 Back
BackSampling Distributions: Foundations and Applications in Business Statistics
Study Guide - Smart Notes
 Tailored notes based on your materials, expanded with key definitions, examples, and context.
Chapter 5: Sampling Distributions
5.1 The Concept of a Sampling Distribution
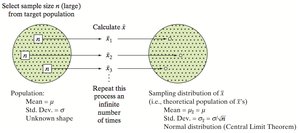
Sampling distributions are fundamental in statistical inference, providing the theoretical basis for estimating population parameters from sample statistics. A sampling distribution is the probability distribution of a given statistic based on a random sample. Understanding this concept is essential for making valid inferences about populations.
Parameter: A numerical descriptive measure of a population (e.g., population mean μ, population variance σ^2).
Statistic: A numerical descriptive measure of a sample (e.g., sample mean \overline{x}, sample variance s^2).
Sampling Distribution: The probability distribution of a sample statistic calculated from all possible samples of size n from a population.
Example: If a population consists of the values {1, 2, 3, 4}, all possible samples of size 2 (with replacement) can be listed, and the sample means calculated. The distribution of these means forms the sampling distribution of the sample mean.
5.2 Properties of Sampling Distributions: Unbiasedness and Minimum Variance
Two critical properties of sampling distributions are unbiasedness and minimum variance. These properties help determine the quality of estimators used in statistical inference.
Unbiased Estimator: An estimator whose expected value equals the population parameter it estimates. For example, the sample mean \overline{x} is an unbiased estimator of the population mean μ.
Biased Estimator: An estimator whose expected value does not equal the population parameter.
Minimum Variance Unbiased Estimator (MVUE): Among all unbiased estimators, the one with the smallest variance is preferred.
Example: If the mean of the sampling distribution of \overline{x} is equal to μ, then \overline{x} is an unbiased estimator of μ.
5.3 The Sampling Distribution of the Sample Mean and the Central Limit Theorem
The sampling distribution of the sample mean is central to inferential statistics. The Central Limit Theorem (CLT) states that, for a sufficiently large sample size, the sampling distribution of the sample mean will be approximately normal, regardless of the population's distribution.
Mean of Sampling Distribution:
Standard Error of the Mean:
Central Limit Theorem: For large n (typically n ≥ 30), the sampling distribution of \overline{x} is approximately normal, even if the population distribution is not normal.
Example: If the mean call duration is 8 minutes with a standard deviation of 2 minutes, and samples of 25 calls are taken, the distribution of sample means will be approximately normal with mean 8 and standard error .
5.4 The Sampling Distribution of the Sample Proportion
The sample proportion, denoted \hat{p}, is used to estimate the population proportion p. The sampling distribution of \hat{p} has properties similar to those of the sample mean.
Mean of Sampling Distribution:
Standard Error of the Proportion:
For large samples, the sampling distribution of \hat{p} is approximately normal (sample is large if both np ≥ 5 and n(1-p) ≥ 5).
Example: If 60% of a population prefers a product (p = 0.6), and a sample of 100 is taken, the standard error is .
Key Ideas and Summary Table
Sampling distribution provides the theoretical foundation for statistical inference.
Unbiased estimators have expected values equal to the population parameter.
Central Limit Theorem ensures normality of the sampling distribution for large samples.
Sample mean and sample proportion are both minimum-variance unbiased estimators of their respective population parameters.
Statistic | Population Parameter | Mean of Sampling Distribution | Standard Error | Approximate Distribution (Large n) |
|---|---|---|---|---|
Sample Mean (\overline{x}) | Population Mean (μ) | μ | Normal | |
Sample Proportion (\hat{p}) | Population Proportion (p) | p | Normal |
Additional info: The Central Limit Theorem is one of the most important results in statistics, as it justifies the use of normal probability models for inference even when the population distribution is not normal, provided the sample size is sufficiently large.
