Back
Statistical Thinking and Methods for Describing Data
Study Guide - Learn with Videos
 Curated lessons matched to your uploaded material – learn every topic step by step.
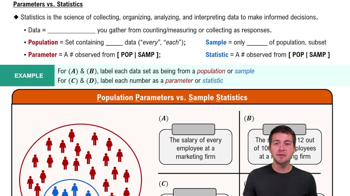
Intro to Stats
- Guided course
 05:53

- Guided course 04:24
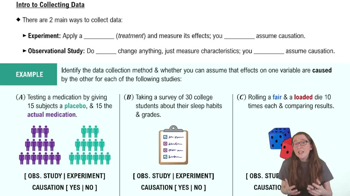
Intro to Collecting Data
- Guided course 4:01
Sampling Methods
- Guided course 04:17
- Guided course 01:30
- Guided course 03:07
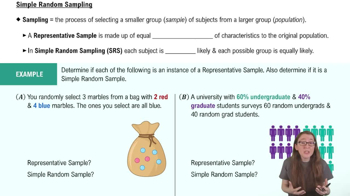
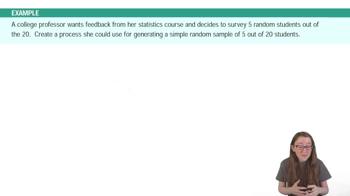
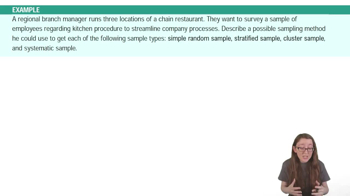
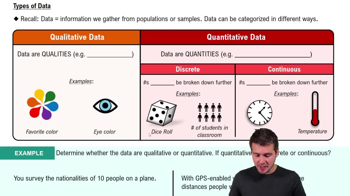
Visualizing Qualitative vs. Quantitative Data
- Guided course 04:39
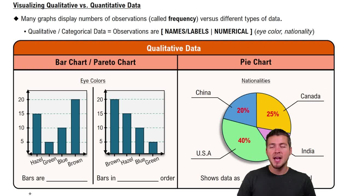
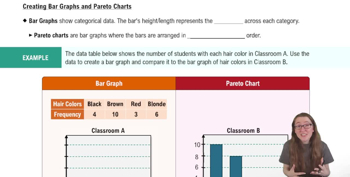
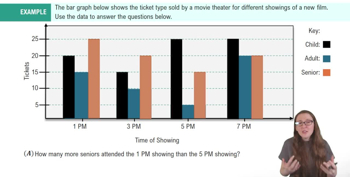
Bar Graphs and Pareto Charts
- Guided course 04:52
- Guided course 05:26
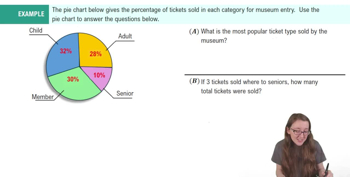
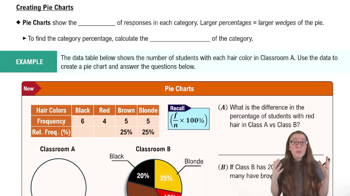
Pie Charts
- Guided course 01:18
- Guided course 06:10
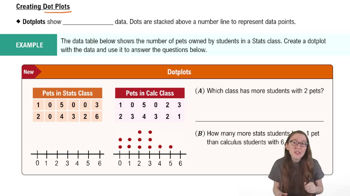
Dot Plots
- Guided course 04:01
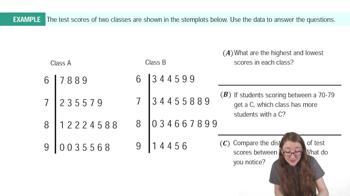
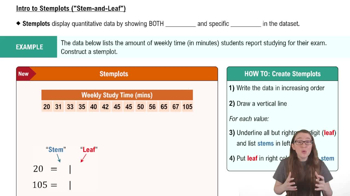
Stemplots (Stem-and-Leaf Plots)
- Guided course 06:09
- Guided course 06:23
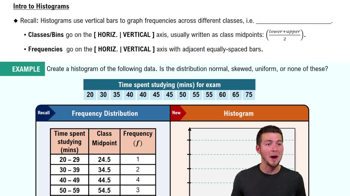
Histograms
- Guided course 05:54