 Back
Statistics for Business Practice Test Guidance
Study Guide - Smart Notes
 Tailored notes based on your materials, expanded with key definitions, examples, and context.
Q1. The following ANOVA experiment has four groups with eight values in each. Fill in all missing values.
Background
Topic: One-way ANOVA (Analysis of Variance)
This question tests your understanding of the ANOVA table, including how to calculate degrees of freedom, sum of squares, mean squares, and the F statistic for comparing group means.
Key Terms and Formulas:
Degrees of Freedom (df): Among groups = , Within groups = , Total =
Sum of Squares (SS): Measures variation. SS Total = SS Among groups + SS Within groups
Mean Square (MS):
F Statistic:
Step-by-Step Guidance
Calculate the degrees of freedom for each source: Among groups (), Within groups (), and Total (). Here, groups and per group, so .
Fill in the missing sum of squares using the relationship: .
Compute mean squares for each source: , .
Set up the F statistic formula: .
Try solving on your own before revealing the answer!
Final Answer:
Degrees of freedom: Among groups = 3, Within groups = 28, Total = 31.
Sum of squares: Among groups = 80, Within groups = 560, Total = 640.
Mean squares: Among groups = , Within groups = .
F statistic: .
These values complete the ANOVA table for the experiment.
Q2. Emergency room wait times: At the 0.05 level of significance, is there evidence of a difference in the mean waiting times in the four locations?
Background
Topic: One-way ANOVA for comparing means
This question tests your ability to use ANOVA to determine if there are statistically significant differences in mean waiting times across four locations.
Key Terms and Formulas:
Null hypothesis (): All means are equal.
Alternative hypothesis (): At least one mean differs.
F statistic:
Significance level:
Step-by-Step Guidance
State the hypotheses: : , : Not all means are equal.
Calculate the group means and overall mean from the data.
Compute the sum of squares between groups and within groups.
Calculate mean squares and the F statistic.
Compare the F statistic to the critical value for and (since per group).
Try solving on your own before revealing the answer!
Final Answer:
There is evidence of a difference in mean waiting times among the four locations at the 0.05 significance level if the calculated F statistic exceeds the critical value. The ANOVA test would reject the null hypothesis if .
This means at least one location has a significantly different mean waiting time.
Q2.ii. If appropriate, determine which locations differ in mean waiting time.
Background
Topic: Post-hoc analysis after ANOVA
This question tests your ability to use pairwise comparisons (such as Tukey's HSD) to identify which groups differ after finding a significant ANOVA result.
Key Terms and Formulas:
Tukey's HSD (Honestly Significant Difference): Used for pairwise comparisons.
Critical value: from the studentized range distribution.
Formula:
Step-by-Step Guidance
Calculate the mean waiting time for each location.
Compute the Tukey HSD value using the formula above.
Compare the absolute differences between each pair of means to the HSD value.
Identify which pairs have differences greater than the HSD threshold.
Try solving on your own before revealing the answer!
Final Answer:
Locations with mean differences greater than the Tukey HSD value are significantly different. List the pairs where this occurs.
This identifies which specific locations differ in mean waiting time.
Q2.iii. At the 0.05 level of significance, is there evidence of a difference in the variation in waiting time among the four locations?
Background
Topic: Test for equality of variances (Levene's test or Bartlett's test)
This question tests your ability to assess whether the variances of waiting times are equal across groups.
Key Terms and Formulas:
Levene's test: Used to test equality of variances.
Null hypothesis (): All group variances are equal.
Alternative hypothesis (): At least one variance differs.
Step-by-Step Guidance
State the hypotheses for the test of equal variances.
Calculate the sample variance for each location.
Apply Levene's test or Bartlett's test to the variances.
Compare the test statistic to the critical value or p-value at .
Try solving on your own before revealing the answer!
Final Answer:
If the test statistic is significant, there is evidence of a difference in variation among the four locations. Otherwise, variances are not significantly different.
This helps determine if the assumption of equal variances holds for ANOVA.
Q3.i. At the 0.05 level of significance, is there evidence of a difference among the industries with respect to the proportion of executives that say their companies are currently investing in business sensor technology?
Background
Topic: Chi-square test for independence
This question tests your ability to use the chi-square test to compare proportions across multiple groups.
Key Terms and Formulas:
Null hypothesis (): Proportions are equal across industries.
Chi-square statistic:
Degrees of freedom:
Step-by-Step Guidance
State the hypotheses: : Proportions are equal, : At least one proportion differs.
Calculate the expected counts for each industry based on the overall proportion.
Compute the chi-square statistic using observed and expected counts.
Compare the statistic to the critical value at .
Try solving on your own before revealing the answer!
Final Answer:
If the chi-square statistic exceeds the critical value, there is evidence of a difference among industries in the proportion investing in sensor technology.
This means at least one industry differs from the others.
Q3.ii. Determine the p-value and interpret its meaning.
Background
Topic: P-value interpretation in hypothesis testing
This question tests your ability to calculate and interpret the p-value for a chi-square test.
Key Terms and Formulas:
P-value: Probability of observing a test statistic as extreme as the one calculated, assuming is true.
Chi-square distribution with .
Step-by-Step Guidance
Calculate the p-value using the chi-square statistic and degrees of freedom.
Compare the p-value to .
Interpret: If p-value , reject ; otherwise, fail to reject .
Try solving on your own before revealing the answer!
Final Answer:
The p-value quantifies the evidence against the null hypothesis. If it is less than 0.05, there is significant evidence of a difference among industries.
Interpretation: A small p-value means the observed differences are unlikely due to chance.
Q3.iii. If appropriate, use the Marascuilo procedure and to determine which companies differ in their current investment in business sensor technology.
Background
Topic: Marascuilo procedure for pairwise comparison of proportions
This question tests your ability to use the Marascuilo procedure to identify which pairs of industries differ in their proportions.
Key Terms and Formulas:
Marascuilo critical value:
Compare absolute differences in proportions to critical values.
Step-by-Step Guidance
Calculate the proportion for each industry.
Compute the absolute difference between each pair of proportions.
Calculate the Marascuilo critical value for each pair.
Identify pairs where the difference exceeds the critical value.
Try solving on your own before revealing the answer!
Final Answer:
Industries with pairwise differences greater than the Marascuilo critical value are significantly different in their investment proportions.
List the pairs where this occurs.
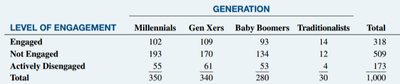
Q4. At the 0.05 level of significance, is there evidence of a significant relationship between generation and level of engagement in the workplace?
Background
Topic: Chi-square test for independence in contingency tables
This question tests your ability to use the chi-square test to determine if there is an association between two categorical variables: generation and engagement level.
Key Terms and Formulas:
Null hypothesis (): No relationship between generation and engagement level.
Chi-square statistic:
Degrees of freedom: , where = number of rows, = number of columns.
Step-by-Step Guidance
State the hypotheses: : No association, : There is an association.
Calculate expected counts for each cell: .
Compute the chi-square statistic using observed and expected counts.
Determine the degrees of freedom: .
Compare the chi-square statistic to the critical value at .
Try solving on your own before revealing the answer!
Final Answer:
If the chi-square statistic exceeds the critical value, there is evidence of a significant relationship between generation and engagement level.
This means engagement varies by generation.
Q5. A marketing analyst wants to compare the median number of weekly sales leads generated by two digital advertising strategies. Independent samples are collected from each strategy. At the 0.05 significance level, test whether the median weekly sales leads differ between the two advertising strategies.
Background
Topic: Nonparametric test for medians (Mann-Whitney U test)
This question tests your ability to use a nonparametric test to compare medians between two independent samples.
Key Terms and Formulas:
Mann-Whitney U test: Used to compare medians of two independent samples.
Null hypothesis (): Medians are equal.
Alternative hypothesis (): Medians differ.
Rank all values and calculate U statistic.
Step-by-Step Guidance
Combine all sample values and rank them from lowest to highest.
Sum the ranks for each group.
Calculate the U statistic for each group using .
Determine the critical value for U at .
Try solving on your own before revealing the answer!
Final Answer:
If the calculated U statistic is less than or equal to the critical value, there is evidence that the medians differ between the two strategies.
This means the advertising strategies generate different median weekly sales leads.
