Back

Statistics for Business Sciences: Course Syllabus and Study Guide

Study Guide - Learn with Videos

Curated lessons matched to your uploaded material – learn every topic step by step.

Basic Concepts of Probability

  • Guided course
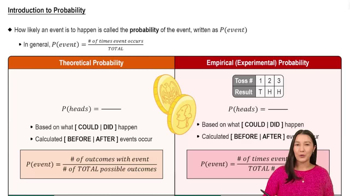
    Introduction to Probability
    5:37

Sampling Distribution of the Sample Mean and Central Limit Theorem

  • Guided course
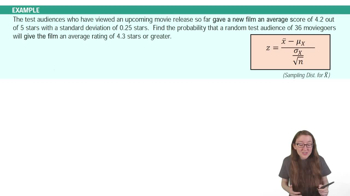
    Central Limit Theorem Example 1
    02:33
  • Guided course
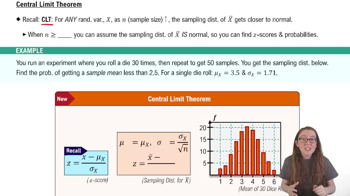
    Central Limit Theorem
    05:14
  • Guided course
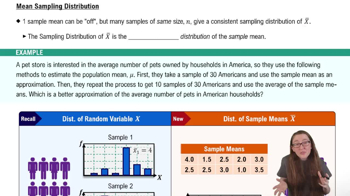
    Sampling Distribution of Sample Mean
    06:53

Introduction to Confidence Intervals

  • Guided course
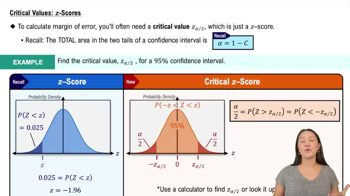
    Critical Values: z Scores
    04:46
  • Guided course
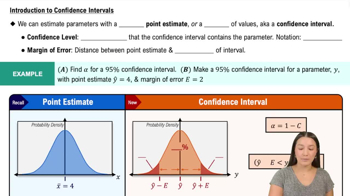
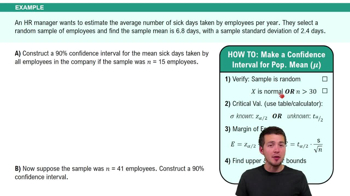
    Introduction to Confidence Intervals
    06:33

Confidence Intervals for Population Mean

  • Guided course
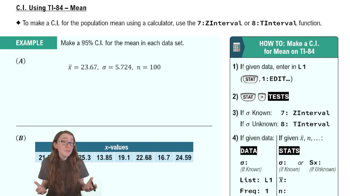
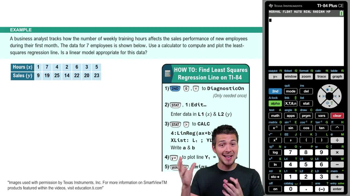
    Finding Confidence Intervals Using TI-84
    04:30
  • Guided course
     Critical Values: t-Distribution Example 2
    04:06
  • Guided course
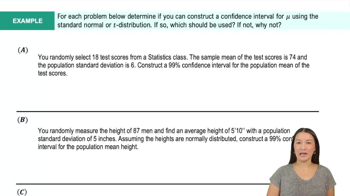
    Population Standard Deviation Unknown Example 3
    09:00

Steps in Hypothesis Testing

  • Guided course
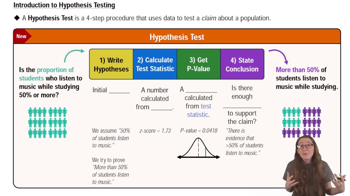
    Intro to Hypothesis Testing
    05:12
  • Guided course
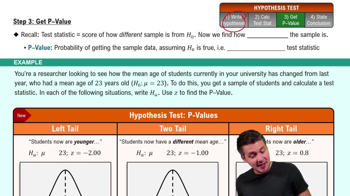
    Step 3: Get P-Value
    06:50
  • Guided course
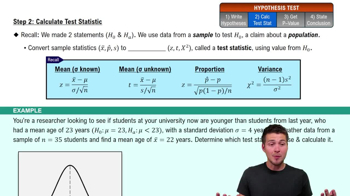
    Step 2: Calculate Test Statistic
    06:34

Performing Hypothesis Tests: Means

  • Guided course
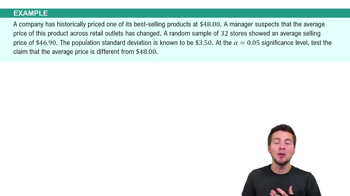
    Standard Deviation (σ) Known Example 2
    04:53
  • Guided course
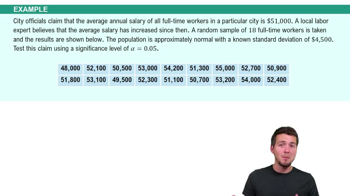
    Standard Deviation (σ) Known Example 3
    06:51
  • Guided course
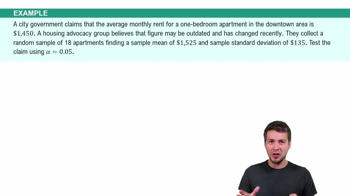
    Standard Deviation (σ) Unknown Example 4
    06:13

Sampling Methods

  • Guided course
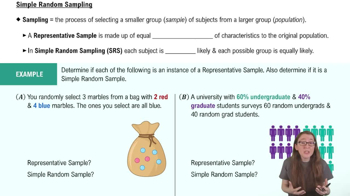
    Simple Random Sampling
    04:17
  • Guided course
    Simple Random Sampling Example 1
    01:30
  • Guided course
    Sampling Methods Example 2
    03:07

Visualizing Qualitative vs. Quantitative Data

  • Guided course
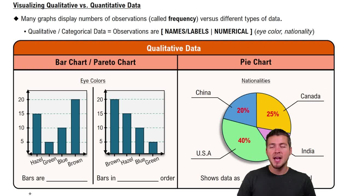
    Visualizing Qualitative vs. Quantitative Data
    04:39

Correlation Coefficient

  • Guided course
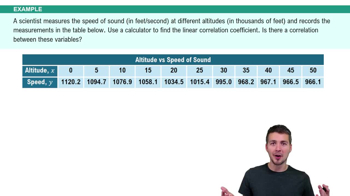
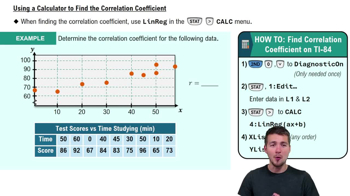
    Calculating Correlation Coefficient - Graphing Calculator Example 1
    03:44
  • Guided course
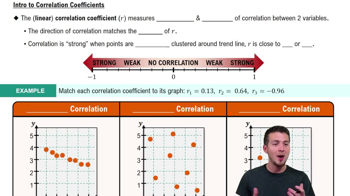
    Correlation Coefficient
    05:43
  • Guided course
    Calculating Correlation Coefficient - Graphing Calculator
    04:40

Linear Regression & Least Squares Method

  • Guided course
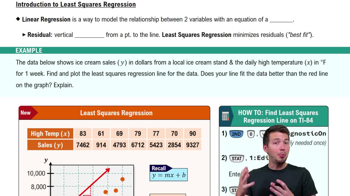
    Intro to Least Squares Regression
    07:01
  • Guided course
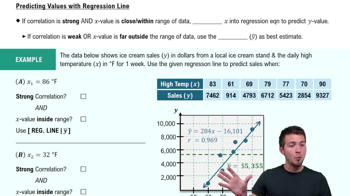
    Using Regression Lines to Predict Values
    04:57
  • Guided course
    Intro to Least Squares Regression Example 1
    05:02

Two-Way ANOVA

  • Guided course
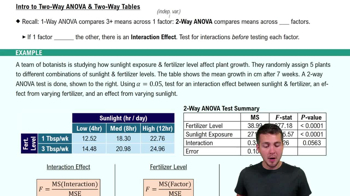
    Intro to Two-Way ANOVA & Two-Way Tables
    08:17
  • Guided course
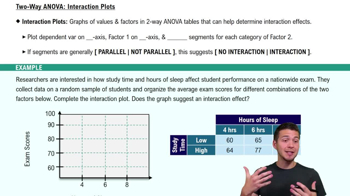
    Two-Way ANOVA: Interaction Plots
    06:35
  • Guided course
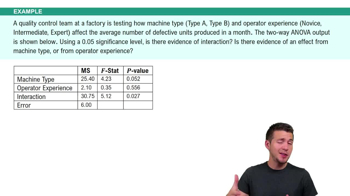
    Intro to Two-Way ANOVA & Two-Way Tables Example 1
    05:00