 Back
Step-by-Step Study Guide for Statistics for Business Exam Questions
Study Guide - Smart Notes
 Tailored notes based on your materials, expanded with key definitions, examples, and context.
Q1. Probability that the newsletter predicts an increase in the stock market value during the next year
Background
Topic: Conditional Probability & Total Probability
This question tests your understanding of conditional probabilities and how to use a tree diagram to calculate the overall probability of an event (here, the newsletter predicting an increase).
Key Terms and Formulas
: Probability the stock market increases = 0.65
: Probability newsletter predicts increase given market increases = 0.80
: Probability newsletter predicts increase given market decreases = 0.42
: Probability market does not increase = 1 - P(A) = 0.35
Total Probability Formula:
Step-by-Step Guidance
Identify the relevant probabilities: , , , .
Set up the tree diagram with branches for market increase () and decrease (), and for newsletter prediction ().
Apply the total probability formula: .
Plug in the values, but do not compute the final sum yet.
Try solving on your own before revealing the answer!
Final Answer: 0.667
The probability that the newsletter predicts an increase in the stock market value during the next year is 0.667.
Q2. What percent of the females had no opinion?
Background
Topic: Percentages and Contingency Tables
This question tests your ability to calculate percentages from a contingency table.
Key Terms and Formulas
Number of females with no opinion: 10
Total number of females: 14 (Approved) + 10 (No Opinion) + 7 (Did Not Approve) = 31
Percentage formula:
Step-by-Step Guidance
Find the total number of females: .
Identify the number of females with no opinion: $10$.
Set up the percentage formula: .
Prepare to calculate the percentage, but do not compute the final value yet.
Try solving on your own before revealing the answer!
Final Answer: 32.26%
About 32.26% of the females had no opinion.
Q3. If and , what is if A and B are independent?
Background
Topic: Probability of Union of Independent Events
This question tests your understanding of how to calculate the probability of the union of two independent events.
Key Terms and Formulas
Probability of union:
For independent events:
Step-by-Step Guidance
Write down the formula for the union: .
Since A and B are independent, calculate .
Plug in the values: , .
Set up the calculation, but do not compute the final value yet.
Try solving on your own before revealing the answer!
Final Answer: 0.70
The probability that either A or B occurs is 0.70.
Q4. What is the probability an adult male has high cholesterol and high blood pressure?
Background
Topic: Joint Probability and Contingency Tables
This question tests your ability to use information from a contingency table to find the joint probability of two events.
Key Terms and Formulas
Joint probability:
Given: , ,
Contingency table: Organizes probabilities for combinations of events.
Step-by-Step Guidance
List all probabilities: , , .
Recall that the sum of all four joint probabilities must equal 1.
Set up the contingency table and use the given values to solve for .
Prepare to calculate the joint probability, but do not compute the final value yet.
Try solving on your own before revealing the answer!
Final Answer: 0.0864
Using the contingency table and the given probabilities, .
This is the probability that an adult male has both high cholesterol and high blood pressure.
Q5. Given that a male has high blood pressure, what is the probability he has high cholesterol?
Background
Topic: Conditional Probability
This question tests your ability to calculate conditional probability from a contingency table.
Key Terms and Formulas
Conditional probability:
From previous question: ,
Step-by-Step Guidance
Recall the formula: .
Use the values from the contingency table: and .
Set up the calculation, but do not compute the final value yet.
Try solving on your own before revealing the answer!
Final Answer: 0.32
Given that a male has high blood pressure, the probability he has high cholesterol is 0.32.
Q6. Given that a mechanic has already determined that the spark plugs are bad, what is the probability that the wires are bad?
Background
Topic: Conditional Probability
This question tests your ability to calculate conditional probability using joint and marginal probabilities.
Key Terms and Formulas
Probability spark plugs are bad:
Probability wires are bad:
Probability both are bad:
Conditional probability:
Step-by-Step Guidance
Write the conditional probability formula: .
Plug in the values: , .
Set up the calculation, but do not compute the final value yet.
Try solving on your own before revealing the answer!
Final Answer: 0.25
Given that the spark plugs are bad, the probability that the wires are bad is 0.25.
Q7. If two events are mutually exclusive then they are also independent.
Background
Topic: Mutually Exclusive vs. Independent Events
This question tests your understanding of the difference between mutually exclusive and independent events.
Key Terms and Formulas
Mutually exclusive: Events cannot occur together ()
Independent: Occurrence of one does not affect the probability of the other ()
Step-by-Step Guidance
Recall the definitions of mutually exclusive and independent events.
Consider whether can equal for nonzero probabilities.
Think about whether both properties can be true at the same time.
Try solving on your own before revealing the answer!
Final Answer: False (B)
Mutually exclusive events cannot be independent unless one has probability zero. If and , they are not independent.
Q8. Which of the following is not a binomial model?
Background
Topic: Binomial Distribution
This question tests your ability to identify situations where the binomial model applies.
Key Terms and Formulas
Binomial model: Fixed number of trials, each trial has two outcomes (success/failure), constant probability, independent trials.
Step-by-Step Guidance
Review each scenario for the four binomial conditions.
Check if the trials are independent and if the probability of success is constant.
Look for cases where the trials are not independent (e.g., sampling without replacement).
Identify which scenario violates the binomial assumptions.
Try solving on your own before revealing the answer!
Final Answer: C
Picking cards without replacement violates the independence assumption, so it is not a binomial model.
Q9. Which statement below is incorrect regarding the binomial formula for San Diego college students?
Background
Topic: Binomial Distribution Assumptions
This question tests your understanding of the requirements for applying the binomial formula.
Key Terms and Formulas
Binomial formula: Requires two outcomes, independence, constant probability.
Step-by-Step Guidance
Review each statement for accuracy regarding binomial assumptions.
Check if there are more than two outcomes.
Consider the independence and probability requirements.
Try solving on your own before revealing the answer!
Final Answer: C
There are only two outcomes (oppose or favor), so statement C is incorrect.
Q10. What is the probability that Markus will catch 3 waves?
Background
Topic: Probability Distribution
This question tests your ability to use the probability distribution to find the probability of a specific outcome.
Key Terms and Formulas
Probability distribution: Probabilities for all possible outcomes must sum to 1.
Step-by-Step Guidance
List all given probabilities: 0 waves (0.1), 1 wave (0.1), 2 waves (0.2), 4 or more waves (0.4).
Sum the given probabilities and check if any are missing.
Calculate the probability for 3 waves by subtracting the sum of the other probabilities from 1.
Set up the calculation, but do not compute the final value yet.
Try solving on your own before revealing the answer!
Final Answer: 0.2
The probability for 3 waves is .
Markus has a 0.2 probability of catching 3 waves.
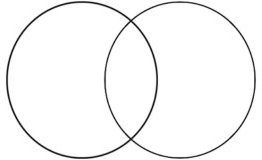
Q36. Fill in all 4 areas of the Venn diagram below with appropriate probabilities.
Background
Topic: Venn Diagrams and Probability
This question tests your ability to use Venn diagrams to represent probabilities of events and their intersections.
Key Terms and Formulas
Venn diagram: Visual representation of probabilities for two events and their intersection.
Areas: Only calculus (C only), only physics (P only), both (C and P), neither.
Probabilities: , , , , ,
Step-by-Step Guidance
Recall the given probabilities: , , .
Calculate using .
Calculate using .
Calculate using the total probability (sum to 1).
Assign each probability to the correct area in the Venn diagram, but do not reveal the final values yet.
Try solving on your own before revealing the answer!
Final Answer:
Area 1 (Only Calculus): 0.09
Area 2 (Both Calculus and Physics): 0.84
Area 3 (Only Physics): 0.05
Area 4 (Neither): 0.02
These values are calculated using the relationships between the probabilities and the total probability.
