 Back
Calc 9: Arc Length, Curvature, and Functions of Several Variables
Study Guide - Smart Notes
 Tailored notes based on your materials, expanded with key definitions, examples, and context.
Arc Length and Curvature of Vector Functions
Arc Length for Vector Functions
The arc length of a curve described by a vector function provides a measure of the distance along the curve between two points. For a parameterized curve \( \mathbf{r}(t) = \langle f(t), g(t), h(t) \rangle \), where \( f', g', h' \) are continuous and \( t \) ranges from \( a \) to \( b \), the arc length \( L \) is given by:
\( L = \int_a^b \sqrt{f'(t)^2 + g'(t)^2 + h'(t)^2} \, dt = \int_a^b |\mathbf{r}'(t)| \, dt \)
This formula generalizes the arc length calculation from single-variable calculus to curves in higher dimensions.
Curvature
Curvature measures how sharply a curve bends at a given point. For a smooth parameterized curve \( \mathbf{r}(t) \):
Let \( \mathbf{v} = \mathbf{r}'(t) \) (velocity) and \( \mathbf{T} \) (unit tangent vector).
The curvature \( \kappa(t) \) is given by:
Alternatively, using velocity \( \mathbf{v} \) and acceleration \( \mathbf{a} = \mathbf{v}' \):
Example: For \( \mathbf{r}(t) = (3\cos t, 3\sin t, 4t) \), the curvature is \( \kappa(t) = \frac{3}{25} \).
Functions of Several Variables
Definition: Function, Domain, and Range with Two Independent Variables
A function of two variables \( z = f(x, y) \) assigns a unique real number \( z \) to each point \( (x, y) \) in a set \( D \subset \mathbb{R}^2 \). The set \( D \) is called the domain of \( f \), and the set of all possible output values \( z \) is the range of \( f \).
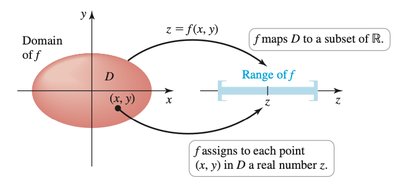
Examples:
\( f(x, y) = x + y \)
\( f(x, y) = \arctan(x^7 + e^{\sin y} + 4) \)
\( f(x, y) = x^2 + y^2 \)
Domains for two-variable functions can be more complex than for single-variable functions, often forming regions or shapes in the plane.
Determining Domains
Example: For \( f(x, y) = \ln(x + y) \), the domain is all \( (x, y) \) such that \( x + y > 0 \), which is a half-plane above the line \( y = -x \).
Example: For \( f(x, y) = \sqrt{x^2 + y^2 - 1} \), the domain is all \( (x, y) \) such that \( x^2 + y^2 \geq 1 \), i.e., on and outside a circle of radius 1 centered at the origin.
Graphs of Functions of Two Variables
Graphs help visualize functions of two variables by representing the set of points \( (x, y, z) \) where \( z = f(x, y) \). This allows us to see features such as maxima, minima, and saddle points.
Example: The graph of \( f(x, y) = \sqrt{x^2 + y^2 - 1} \) is the top half of a hyperboloid of one sheet, since \( z^2 = x^2 + y^2 - 1 \) and only positive \( z \) values are allowed.
Example: The graph of \( f(x, y) = \sqrt{x^2 + y^2} \) is the top half of a cone, since \( z^2 = x^2 + y^2 \) and \( z \geq 0 \).
Level Curves
Level curves of a function \( f(x, y) \) are the sets of points where the function takes a constant value, i.e., \( f(x, y) = c \). These curves are useful for visualizing the behavior of functions, similar to contour lines on a topographical map.
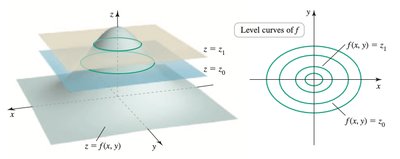
Example: For \( f(x, y) = \sqrt{y - x^2} \), the level curves are parabolas given by \( y = x^2 + c^2 \) for \( c \geq 0 \).
Example: For \( f(x, y) = 5 + e^{2x - 3y} \), the level curves are lines of the form \( 2x - 3y = \ln(c - 5) \).
Level Surfaces
For functions of three variables \( F(x, y, z) \), level surfaces are the sets of points where \( F(x, y, z) = c \). For example, the level surfaces of \( F(x, y, z) = x^2 + y^2 + z^2 \) are spheres centered at the origin.
Functions of n Variables
A function of n variables \( x_{n+1} = f(x_1, x_2, \ldots, x_n) \) assigns a unique real number to each point in a domain \( D \subset \mathbb{R}^n \). In this course, focus is on functions of two and three variables.
