 Back
BackCalculus I: Applications of the Derivative, Curve Sketching, and L'Hôpital's Rule
Study Guide - Smart Notes
 Tailored notes based on your materials, expanded with key definitions, examples, and context.
Mean Value Theorem and Its Applications
Mean Value Theorem (MVT)
The Mean Value Theorem is a fundamental result in calculus that connects the average rate of change of a function to its instantaneous rate of change. It provides a formal guarantee that, under certain conditions, a function will have at least one point where the tangent is parallel to the secant line joining the endpoints.
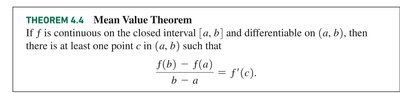
Statement: If f is continuous on the closed interval [a, b] and differentiable on the open interval (a, b), then there exists at least one point c in (a, b) such that
Hypotheses: Continuity on [a, b] and differentiability on (a, b) are required.
Conclusion: There is at least one point where the instantaneous rate of change equals the average rate of change.
Linear Approximation
Definition and Formula
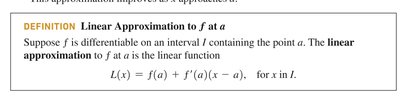
Linear approximation uses the tangent line at a point to approximate the value of a function near that point. This is especially useful for estimating values of functions that are difficult to compute directly.
Formula: For a function f differentiable at a, the linear approximation at a is
Interpretation: The function L(x) is the equation of the tangent line to f at x = a.
Example: Approximating Square Roots
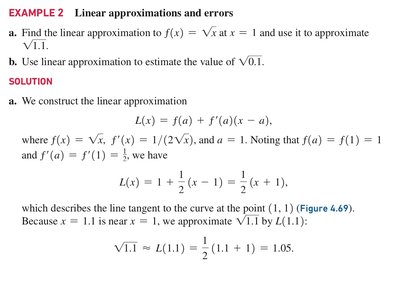
Suppose f(x) = \sqrt{x} and we want to approximate \sqrt{1.1} and \sqrt{0.1} using linear approximation at x = 1.
Step 1: Compute f(1) = 1 and f'(x) = 1/(2\sqrt{x}), so f'(1) = 1/2.
Step 2: The linear approximation is
Step 3: For x = 1.1,
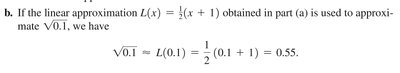
Step 4: For x = 0.1,
L'Hôpital's Rule and Indeterminate Forms
L'Hôpital's Rule
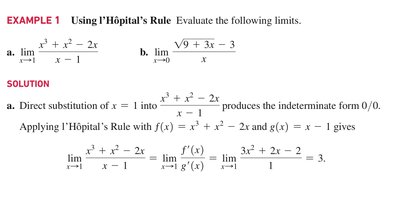
L'Hôpital's Rule is a powerful tool for evaluating limits that result in indeterminate forms such as 0/0 or ∞/∞. The rule states that if the limits of the numerator and denominator both approach 0 or both approach infinity, the limit of the quotient can be found by taking the limit of the quotient of their derivatives.
Statement: If and (or both are ∞), and the derivatives exist near a, then provided the limit on the right exists.
Application: May need to apply the rule more than once if the resulting limit is still indeterminate.
Indeterminate Forms: 0·∞, ∞–∞, 1∞, 00, ∞0
Some limits result in indeterminate forms that require algebraic manipulation before L'Hôpital's Rule can be applied. Common strategies include rewriting products as quotients or using logarithms and exponentials.
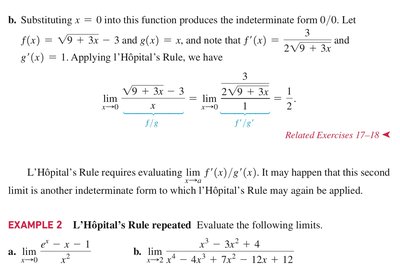
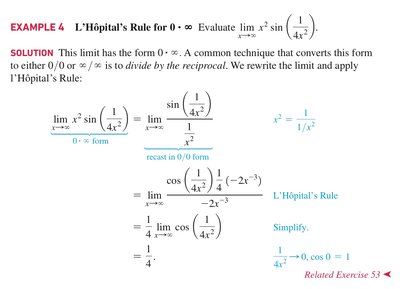
0·∞ and ∞–∞: Convert to 0/0 or ∞/∞ form before applying L'Hôpital's Rule.
1∞, 00, ∞0: Use logarithms to bring the exponent down and convert to a product or quotient.
Procedure: For with an indeterminate form, set , then , and evaluate using L'Hôpital's Rule if necessary.

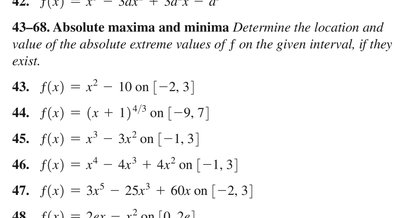
Absolute and Relative Extrema
Definitions and Theorems
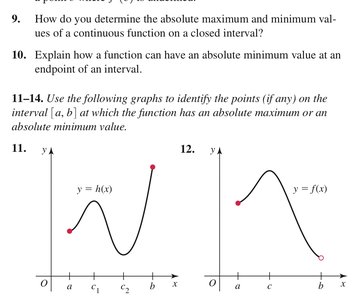
Absolute (Global) Maximum/Minimum: The highest/lowest value of a function on a given interval. Relative (Local) Maximum/Minimum: The highest/lowest value of a function within a neighborhood of a point.
Extreme Value Theorem: If f is continuous on a closed interval [a, b], then f attains both an absolute maximum and an absolute minimum on [a, b].
Finding Extrema: Evaluate f at critical points (where f'(x) = 0 or f'(x) is undefined) and at endpoints.
Examples and Graphical Interpretation
Critical points and endpoints must be checked to determine absolute extrema on a closed interval.
Endpoints can be locations of absolute extrema if the function does not attain higher or lower values elsewhere.

Curve Sketching and Graphing Functions
Guidelines for Graphing
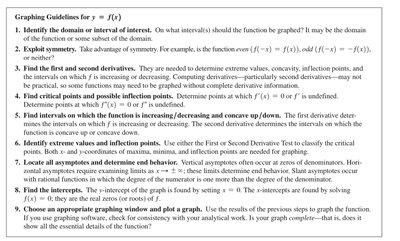
Graphing a function involves a systematic analysis of its properties using calculus. The following steps are recommended:
Identify the domain of the function.
Check for symmetry: Even, odd, or periodic behavior.
Find first and second derivatives: Needed for critical points, inflection points, and concavity.
Find critical points and possible inflection points: Where f'(x) = 0 or f'(x) is undefined.
Determine intervals of increase/decrease and concavity: Use the sign of f'(x) and f''(x).
Identify extreme values and inflection points: Use the First and Second Derivative Tests.
Locate asymptotes and analyze end behavior: Vertical, horizontal, or slant asymptotes.
Find intercepts: Where the graph crosses the axes.
Sketch the graph: Combine all information for an accurate sketch.
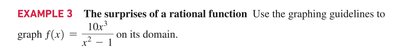
Example: Rational Function
Consider . The graphing process involves:
Domain:
Symmetry: Even function
Critical points: Solve
Intervals of increase/decrease and concavity: Use sign charts for and
Asymptotes: Vertical at , slant as
Intercepts: At
What Derivatives Tell Us
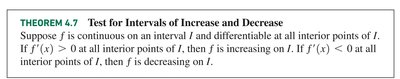
Intervals of Increase and Decrease
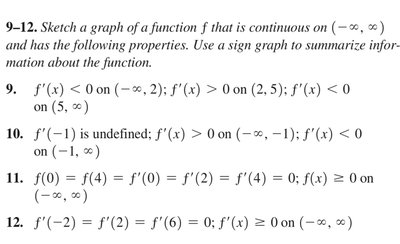
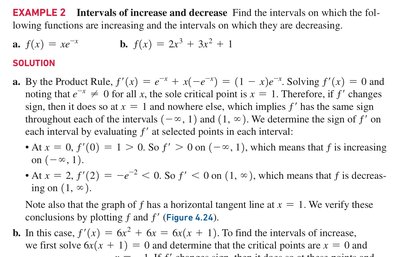
The sign of the first derivative f'(x) determines where a function is increasing or decreasing.
Theorem: If f'(x) > 0 on an interval, f is increasing there. If f'(x) < 0, f is decreasing.
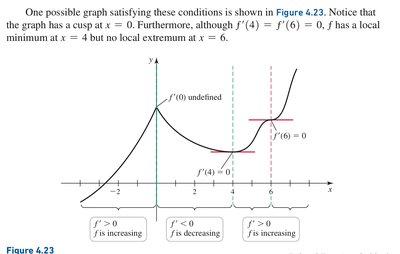
Sketching Functions Using Derivatives
By analyzing the sign of f'(x) and the points where it is zero or undefined, we can sketch the general shape of a function and identify key features such as cusps, corners, and horizontal tangents.
Summary Table: Key Calculus Concepts
Concept | Definition/Formula | Application |
|---|---|---|
Mean Value Theorem | Guarantees a point with tangent parallel to secant | |
Linear Approximation | Estimate function values near a point | |
L'Hôpital's Rule | Evaluate indeterminate limits | |
Absolute Extrema | Check critical points and endpoints | Find global max/min on closed intervals |
Intervals of Increase/Decrease | Sign of | Determine where function rises or falls |
Additional info: These notes synthesize textbook definitions, theorems, and worked examples to provide a comprehensive review of key calculus concepts relevant to applications of the derivative, curve sketching, and L'Hôpital's Rule.
