 Back
BackCurve Sketching and Analysis: Increasing/Decreasing Intervals, Concavity, and Extrema
Study Guide - Smart Notes
 Tailored notes based on your materials, expanded with key definitions, examples, and context.
Q3(a). For the function , state any intervals on which the graph is increasing, decreasing, concave up, and concave down. List all local extrema and points of inflection. Use this information, along with any additional information about the domain, intercepts, or asymptotes of the function to draw a graph.
Background
Topic: Curve Sketching and Analysis
This question tests your ability to analyze a function using calculus concepts such as the first and second derivatives. You will determine where the function is increasing or decreasing, where it is concave up or down, and identify local maxima, minima, and points of inflection. This is a core skill in calculus for understanding the behavior of functions and their graphs.
Key Terms and Formulas
Critical Number: A value of where or is undefined.
First Derivative Test: Used to determine intervals of increase/decrease and local extrema.
Second Derivative Test: Used to determine concavity and points of inflection.
First Derivative: gives the slope of the tangent line to the curve at each point.
Second Derivative: gives information about the concavity of the function.
Key Formulas:
Step-by-Step Guidance
Find the first derivative : Use the power rule to differentiate each term.
Set to find critical numbers: Solve for to find where the function's slope is zero (potential maxima or minima).
Test intervals around the critical numbers: Choose test points in the intervals determined by the critical numbers and plug them into to determine where the function is increasing () or decreasing ().
Find the second derivative : Use the power rule again to differentiate .
Set to find possible inflection points: Solve for to find where concavity may change.
Test intervals around the inflection points: Choose test points in the intervals determined by the inflection points and plug them into to determine where the function is concave up () or concave down ().
Try solving on your own before revealing the answer!
Final Answer:
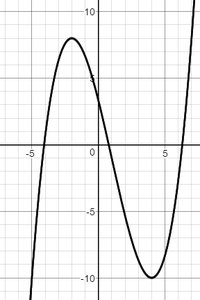
Increasing on , decreasing on and ; concave up on , concave down on ; relative max at , relative min at , point of inflection at .
The graph matches the analysis above, showing the correct intervals and points.
