 Back
BackLimits and Continuity: Chapter 2 Study Guide
Study Guide - Smart Notes
 Tailored notes based on your materials, expanded with key definitions, examples, and context.
Limits and Continuity
Rates of Change and Tangents to Curves
The concept of rate of change is fundamental in calculus, describing how a quantity varies with respect to another. Tangents to curves are closely related, representing the instantaneous rate of change at a point.
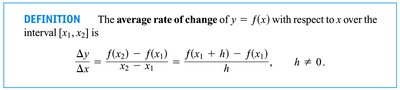
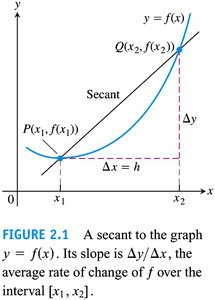
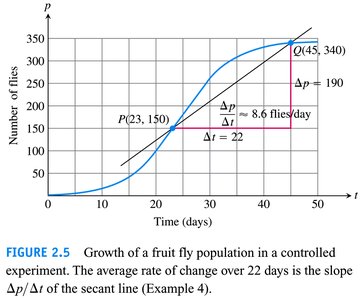
Average Rate of Change: For a function y = f(x) over an interval [x_1, x_2], the average rate of change is given by: ,
Secant Line: The secant line connects two points on the graph of f and its slope represents the average rate of change.
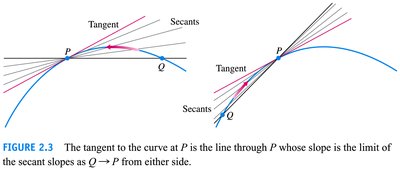
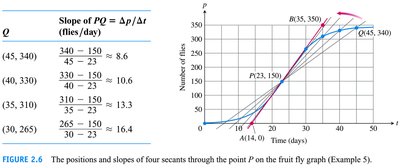
Tangent Line: The tangent at a point is the limit of secant slopes as the second point approaches the first.
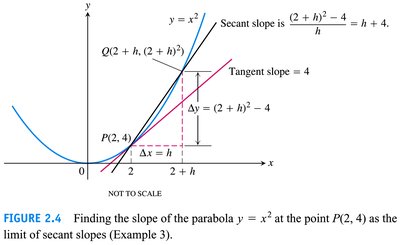
Example: For y = x^2 at P(2, 4), the tangent slope is 4.
Applications: Rate of change can model population growth, such as the number of fruit flies over time.
Limits of Functions and Limit Laws
Limits describe the behavior of functions as inputs approach a specific value. They are foundational for defining continuity and derivatives.
Intuitive Definition: The limit of f(x) as x approaches c is the value L that f(x) gets closer to as x gets closer to c.
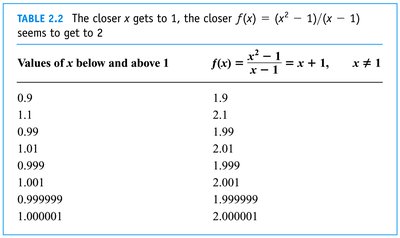
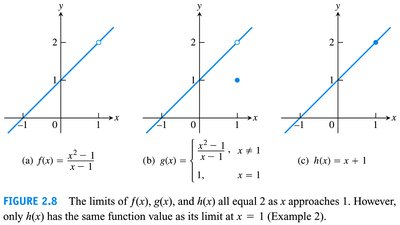
Example: The function f(x) = (x^2 - 1)/(x - 1) is undefined at x = 1, but its limit as x approaches 1 is 2.
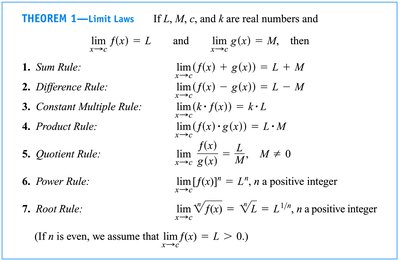
Limit Laws: Fundamental rules for combining limits.
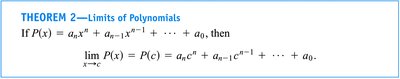
Limits of Polynomials:
Limits of Rational Functions: , if
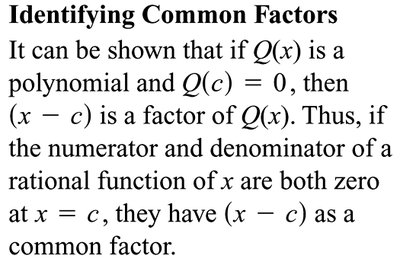
Identifying Common Factors: If both numerator and denominator are zero at x = c, factor and simplify.
Example: and have the same limit as .
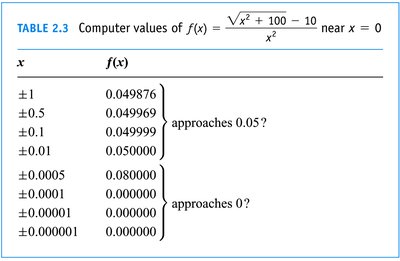
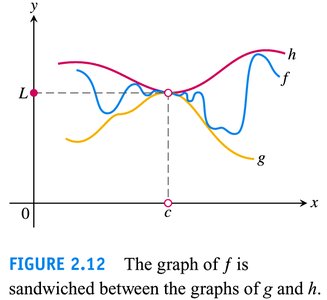
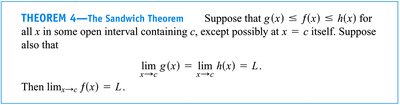
Sandwich Theorem: If and , then .
The Precise Definition of a Limit
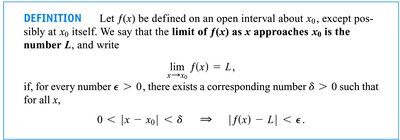
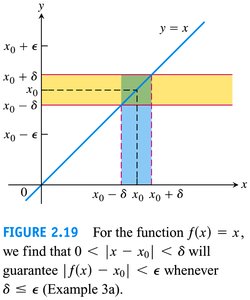
The formal (epsilon-delta) definition of a limit provides mathematical rigor to the intuitive concept.
Definition: if for every , there exists such that
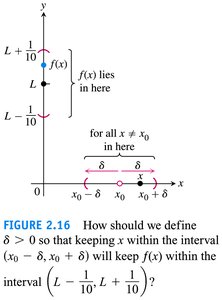
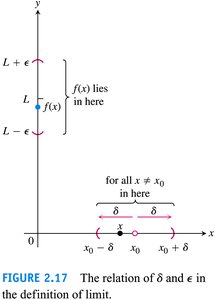
Visual Representation: The relationship between and is illustrated by bounding within whenever is within .
One-Sided Limits
One-sided limits consider the behavior of a function as the input approaches a point from only one direction (left or right).
Left-Hand Limit: is the value approached as comes from values less than .
Right-Hand Limit: is the value approached as comes from values greater than .
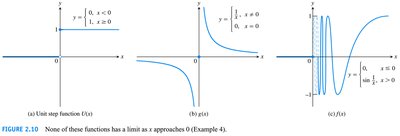
Example: Step functions and functions with jumps may have different one-sided limits.
Continuity
A function is continuous at a point if its value equals its limit at that point. Continuity is essential for many calculus concepts.
Definition: f is continuous at x = c if .
Examples: Polynomials and constant functions are continuous everywhere; rational functions are continuous where their denominators are nonzero.
Discontinuities: Occur at points where the function is not defined or its limit does not equal its value.
Limits Involving Infinity; Asymptotes of Graphs
Limits can describe the behavior of functions as inputs grow without bound or approach points where the function becomes unbounded.
Infinite Limits: means f(x) increases without bound as x approaches c.
Horizontal Asymptotes: If , then y = L is a horizontal asymptote.
Vertical Asymptotes: If f(x) approaches infinity as x approaches c, then x = c is a vertical asymptote.
Example: Rational functions often have vertical and horizontal asymptotes.
