 Back
Logarithmic and Exponential Functions Study Guide (Calculus Context)
Study Guide - Smart Notes
 Tailored notes based on your materials, expanded with key definitions, examples, and context.
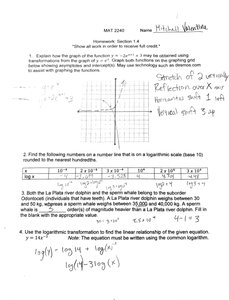
Q1. Explain how the graph of the function y = -2log(x) + 3 is obtained from the graph of y = log(x).
Background
Topic: Transformations of Logarithmic Functions
This question tests your understanding of how to apply transformations (stretch, reflection, translation) to the basic logarithmic function to obtain a new function.
Key Terms and Formulas:
Vertical stretch: Multiplying the function by a constant changes its steepness.
Reflection: Negative sign reflects the graph across the x-axis.
Vertical shift: Adding/subtracting a constant moves the graph up/down.
General transformation:
Step-by-Step Guidance
Start with the base function .
Apply a vertical stretch by multiplying by 2: .
Apply a reflection across the x-axis by multiplying by -1: .
Apply a vertical shift upward by adding 3: .
Describe how each transformation affects the graph (steepness, direction, position).
Try solving on your own before revealing the answer!
Final Answer:
The graph of is obtained by stretching vertically by a factor of 2, reflecting it across the x-axis, and shifting it up by 3 units.
Each transformation changes the graph as follows: the stretch makes it steeper, the reflection flips it upside down, and the shift moves it vertically.
Q2. Find the following numbers on a number line that is on a logarithmic scale (base 10), rounded to the nearest hundredth: 1, 2, 3, 4, 5, 6, 7, 8, 9, 10, 20, 30, 40, 50, 60, 70, 80, 90, 100.
Background
Topic: Logarithmic Scales
This question tests your ability to convert numbers to their logarithmic values (base 10) and place them on a logarithmic scale.
Key Terms and Formulas:
Logarithmic scale: A scale where each unit increase represents a tenfold increase in value.
Base 10 logarithm:
Rounding: Round each value to the nearest hundredth.
Step-by-Step Guidance
For each number, calculate .
Round the result to the nearest hundredth.
Place each value on the number line according to its logarithmic value.
Check your calculations for accuracy before rounding.
Try solving on your own before revealing the answer!
Final Answer:
The logarithmic values (rounded to the nearest hundredth) are:
1: 0.00
2: 0.30
3: 0.48
4: 0.60
5: 0.70
6: 0.78
7: 0.85
8: 0.90
9: 0.95
10: 1.00
20: 1.30
30: 1.48
40: 1.60
50: 1.70
60: 1.78
70: 1.85
80: 1.90
90: 1.95
100: 2.00
These values represent the positions on a logarithmic scale (base 10).
Q3. Both the La Plata river dolphin and the vaquita are declining. Use the logarithmic scale to compare their populations. A table is given showing the suborder odontocete individuals remaining. Explain how to use the logarithmic scale to compare populations.
Background
Topic: Logarithmic Comparison of Populations
This question tests your ability to use logarithmic scales to compare quantities that differ by orders of magnitude, such as populations.
Key Terms and Formulas:
Logarithmic scale: Useful for comparing values that span large ranges.
Population values: Use for each population.
Step-by-Step Guidance
Identify the population numbers for each species.
Calculate the base 10 logarithm for each population: .
Compare the logarithmic values to see the relative difference.
Interpret what the difference in logarithmic values means in terms of actual population size.
Try solving on your own before revealing the answer!
Final Answer:
By converting population numbers to their logarithmic values, you can easily compare the populations even if they differ by several orders of magnitude. For example, if one population is and another is , the first is ten times larger than the second.
Q4. Use the logarithmic transformation to find the linear relationship of the given equation: . Write the equation in linear form using common logarithms.
Background
Topic: Logarithmic Transformations and Linearization
This question tests your ability to use logarithmic transformations to linearize exponential equations, which is a common technique in calculus and data analysis.
Key Terms and Formulas:
Logarithmic transformation: Applying to both sides of an equation.
Linear form: Expressing the relationship as .
Properties of logarithms: , .
Step-by-Step Guidance
Start with the equation .
Take the logarithm of both sides: .
Use logarithm properties to expand the right side.
Express the equation in the form .
Try solving on your own before revealing the answer!
Final Answer:
This is a linear relationship between and , where the slope is and the intercept is .
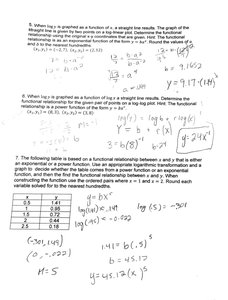
Q5. When log y is graphed as a function of x, a straight line results. The graph of the straight line is given by the equation . Determine the equation for y as a function of x.
Background
Topic: Exponential Functions from Logarithmic Linear Equations
This question tests your ability to convert a linear logarithmic equation back to its exponential form.
Key Terms and Formulas:
Linear logarithmic equation:
Exponential form:
Step-by-Step Guidance
Start with the equation .
Rewrite the equation in exponential form: .
Expand the exponent using properties of exponents.
Express as a product of two terms: .
Try solving on your own before revealing the answer!
Final Answer:
Here, , so the equation expresses as an exponential function of .
Q6. When log y is graphed as a function of log x, a straight line results. Determine the functional relationship between y and x given .
Background
Topic: Power Functions from Log-Log Linear Equations
This question tests your ability to convert a linear log-log equation to a power function.
Key Terms and Formulas:
Log-log linear equation:
Power function:
Exponent and coefficient:
Step-by-Step Guidance
Start with .
Rewrite using properties of logarithms: .
Express as .
Convert to exponential form: .
Try solving on your own before revealing the answer!
Final Answer:
This is a power function where the coefficient is and the exponent is 3.
Q7. The following table is based on a functional relationship between x and y that is either exponential or a power function. Use logarithmic transformations to determine the relationship and write the equation for the function.
Background
Topic: Data Analysis with Logarithmic Transformations
This question tests your ability to use logarithmic transformations to analyze data and determine whether the relationship is exponential or a power function.
Key Terms and Formulas:
Logarithmic transformation: vs for power functions, $\log(y)$ vs for exponential functions.
Linear regression: Find slope and intercept from transformed data.
Equation forms: (power), (exponential)
Step-by-Step Guidance
Transform the data using logarithms: calculate and for each pair.
Plot vs and check if the points form a straight line.
If the relationship is linear, use the slope and intercept to write the power function.
Express the function in the form using the calculated values.
Try solving on your own before revealing the answer!
Final Answer:
The relationship is a power function:
This was determined by linearizing the data with logarithmic transformations and finding the slope and intercept.
