 Back
1.1 & 1.2
Study Guide - Smart Notes
 Tailored notes based on your materials, expanded with key definitions, examples, and context.
Functions
Definition and Basic Properties
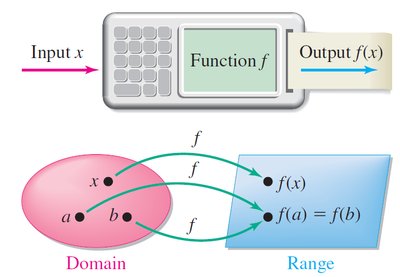
A function is a mathematical rule that assigns to each value x in a set D (the domain) a unique value denoted f(x). The set of all possible output values as x varies over the domain is called the range of the function.
Domain: The set of all input values for which the function is defined.
Range: The set of all output values produced by the function.
Independent variable: The variable associated with the domain.
Dependent variable: The variable associated with the range.
Argument: The expression on which the function operates (e.g., x in f(x)).

Graphical Representation
The graph of a function f is the set of all points (x, y) in the xy-plane that satisfy y = f(x). This visual representation helps to understand the behavior of the function.
Vertical Line Test
Detecting Functions from Graphs
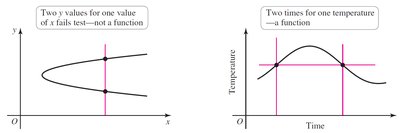
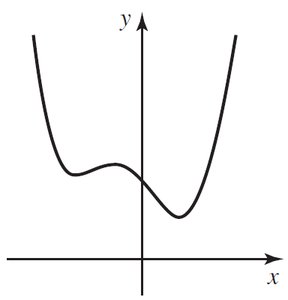
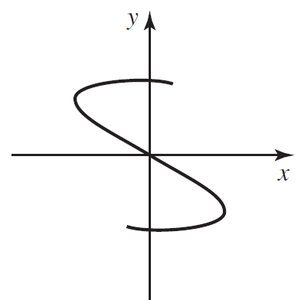
The vertical line test is a method used to determine whether a graph represents a function. A graph passes the vertical line test if every vertical line intersects the graph at most once. If a vertical line intersects the graph more than once, the graph does not represent a function.
Key Point: Each input (x-value) must correspond to only one output (y-value).

Examples of Functions and Non-Functions
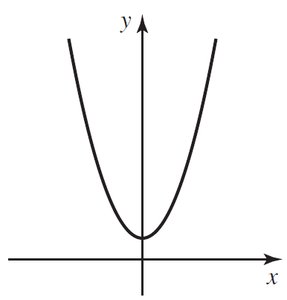
Function: Parabola (e.g., y = x^2) passes the vertical line test.
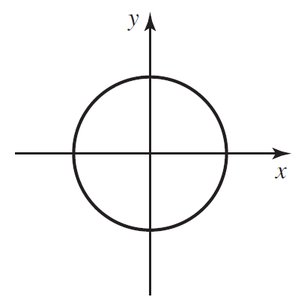
Non-Function: Circle (e.g., x^2 + y^2 = r^2) fails the vertical line test.
Domain and Range
Examples and Applications
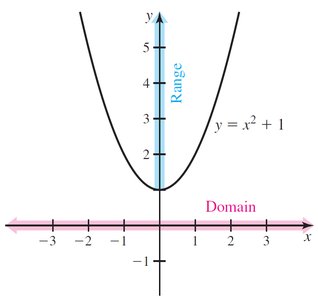
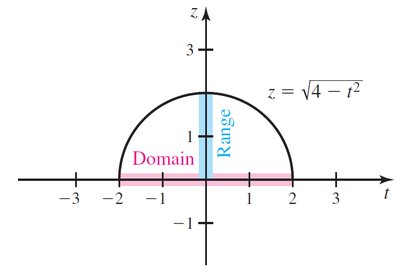
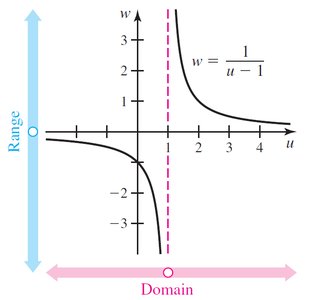
The domain and range of a function depend on its definition and context. For example, the function y = x^2 + 1 is defined for all real numbers, and its range is [1, ∞). For z = \sqrt{4 - t^2}, the domain is [-2, 2] and the range is [0, 2]. For w = \frac{1}{u - 1}, the domain is all real numbers except u = 1, and the range is all real numbers except w = 0.
Domain: All possible input values (e.g., x, t, u).
Range: All possible output values (e.g., y, z, w).
Domain and Range in Context
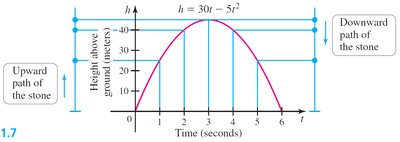
In applied problems, the domain and range are often restricted by physical constraints. For example, the height of a stone thrown upward is modeled by h = 30t - 5t^2 for t in [0, 6], and the range is [0, 45].
Composite Functions
Definition and Evaluation
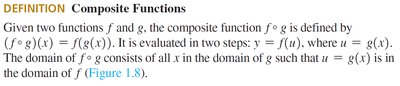
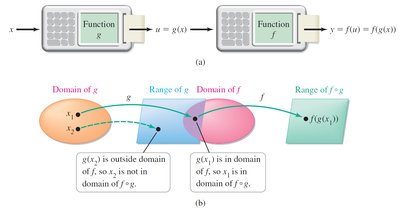
A composite function is formed by combining two functions f and g such that (f \circ g)(x) = f(g(x)). The domain of f \circ g consists of all x in the domain of g for which g(x) is in the domain of f.
Evaluation: First compute g(x), then apply f to the result.
Domain: x must be in the domain of g, and g(x) must be in the domain of f.
Evaluating Composite Functions from Graphs and Tables
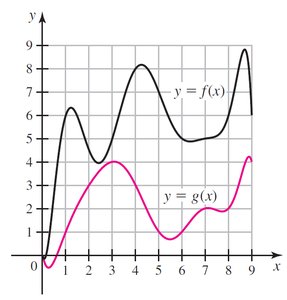
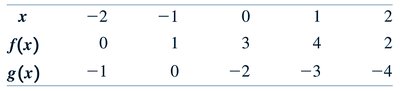
Composite functions can be evaluated using graphs or tables. For example, if f(x) and g(x) are given as graphs, you can find f(g(5)) by first finding g(5) and then f of that value. Tables can also be used for discrete values.
Secant Lines and the Difference Quotient
Average Rate of Change
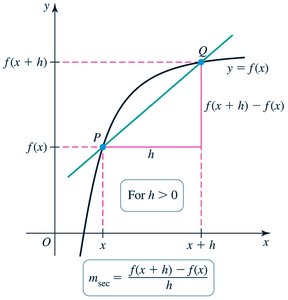
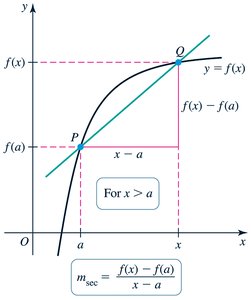
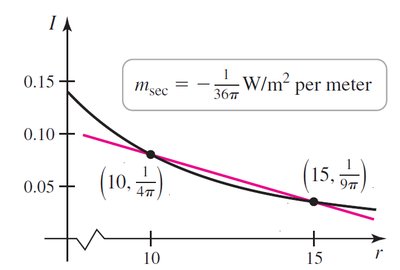
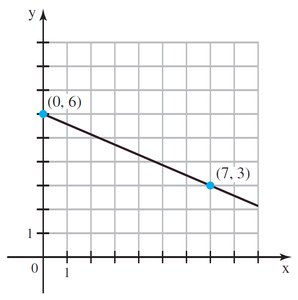
A secant line is a line passing through two points on the graph of a function. The slope of the secant line represents the average rate of change of the function over an interval. The difference quotient is given by:
Formula:
Alternate form:
Applications
The difference quotient is fundamental in calculus, as it leads to the concept of the derivative. In applied contexts, it measures average rates such as sound intensity change over distance.
Symmetry in Functions and Graphs
Types of Symmetry
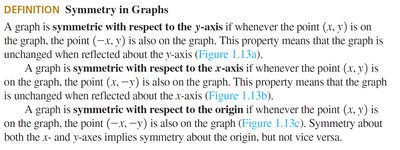
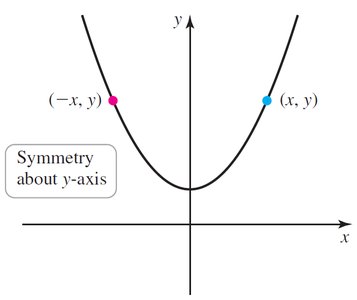
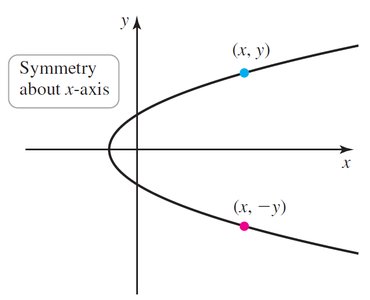
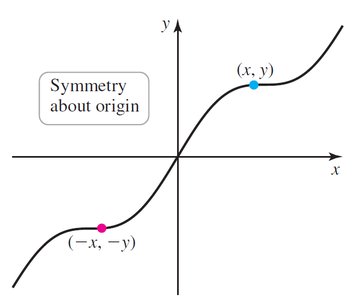
Graphs may exhibit symmetry with respect to the y-axis, x-axis, or origin. These symmetries are defined as follows:
Y-axis symmetry: If (x, y) is on the graph, so is (-x, y).
X-axis symmetry: If (x, y) is on the graph, so is (x, -y).
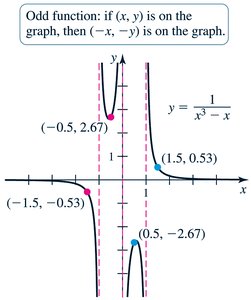
Origin symmetry: If (x, y) is on the graph, so is (-x, -y).
Even and Odd Functions
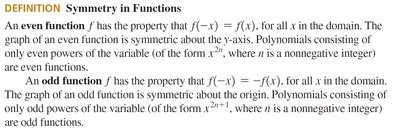
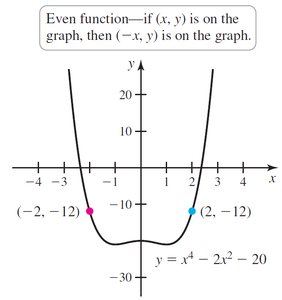
An even function satisfies f(-x) = f(x) for all x in the domain, and its graph is symmetric about the y-axis. An odd function satisfies f(-x) = -f(x) for all x in the domain, and its graph is symmetric about the origin.
Even function: Only even powers of x (e.g., y = x^4 - 2x^2 - 20).
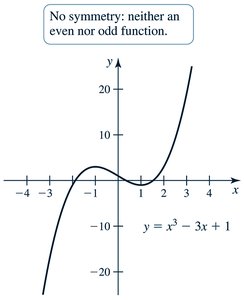
Odd function: Only odd powers of x (e.g., y = x^3 - 3x + 1).
Families of Functions
Classification of Functions
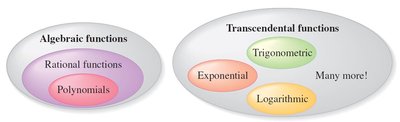
Functions can be classified into several families, each with distinct properties:
Algebraic functions: Include polynomials and rational functions.
Transcendental functions: Include trigonometric, exponential, and logarithmic functions.
Examples of Function Types
Polynomial: f(x) = x^2 + 3x + 2
Rational: f(x) = \frac{x^2 - 1}{x + 2}
Trigonometric: f(x) = \sin(x)
Exponential: f(x) = e^x
Logarithmic: f(x) = \ln(x)
Representing Functions
Formulas, Graphs, Tables, and Words
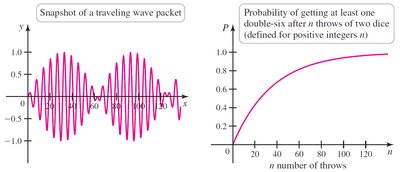
Functions can be represented in multiple ways:
Formulas: Provide explicit mathematical expressions.
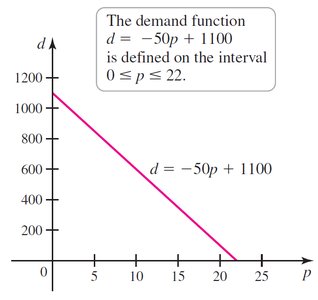
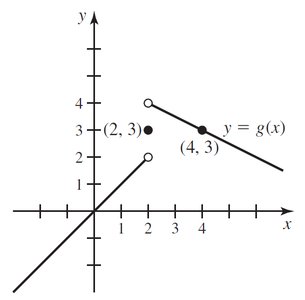
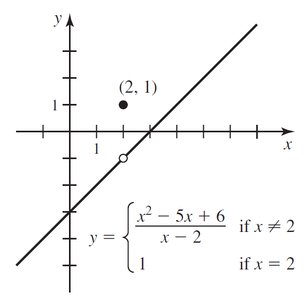
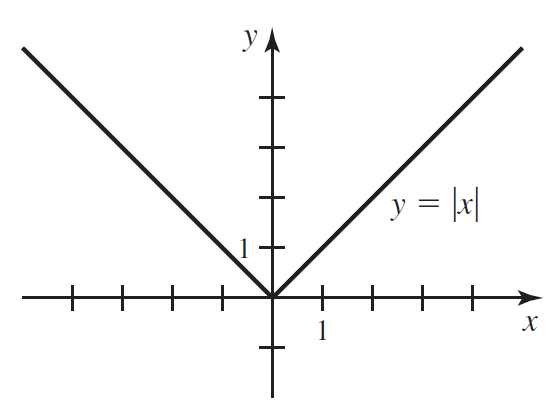
Graphs: Visualize the function's behavior.
Tables: List discrete values of input and output.
Words: Describe the function in context or application.
Power and Root Functions
Power Functions
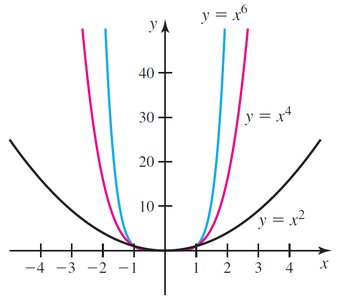
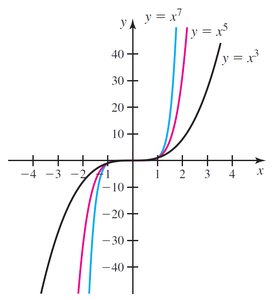
Power functions have the form f(x) = x^n. When n is even, the function is nonnegative and symmetric about the y-axis. When n is odd, the function takes both positive and negative values and is symmetric about the origin.
Root Functions
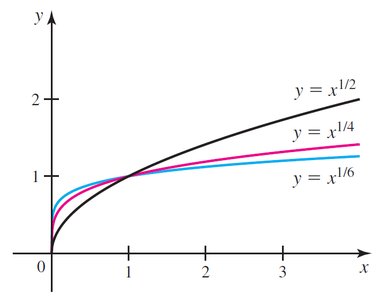
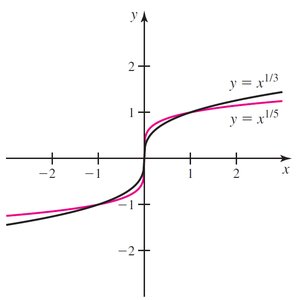
Root functions have the form f(x) = x^{1/n}. Even roots are defined for nonnegative x, while odd roots are defined for all real x.
Rational Functions
Analysis and Graphing
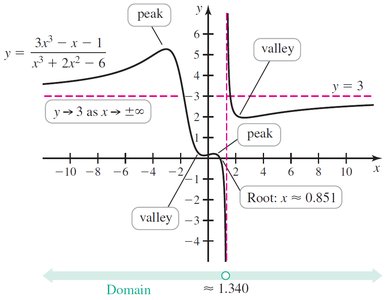
Rational functions are ratios of polynomials. Their domain excludes values where the denominator is zero. Graphs may feature vertical asymptotes, roots, peaks, and valleys.
Functions from Tables
Tabular Representation
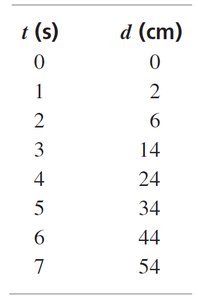
Functions can be represented by tables of values, especially in experimental or applied contexts. For example, the distance fallen by a marble at various times can be tabulated.
 *Additional info: This study guide covers foundational concepts in functions, including definitions, graphical tests, domain and range, composite functions, symmetry, and classification. It is suitable for college calculus students preparing for further study in limits, derivatives, and integrals.*
