Back
BackStudy Guide: Trigonometric Functions, Modeling, and Error Analysis
Study Guide - Smart Notes
 Tailored notes based on your materials, expanded with key definitions, examples, and context.
Q1. Key Points of Parent Graphs for Sine and Cosine
Background
Topic: Graphing Trigonometric Functions
This question focuses on understanding the key points of the parent sine and cosine graphs over one full period, which is foundational for graphing and transforming trigonometric functions.
Key Terms and Formulas:
Amplitude:
Period:
Phase Shift:
Vertical Shift:
General form: or
Step-by-Step Guidance
Identify the parent function (sine or cosine) and note its standard key points over one period.
For , the key points are at .
For , the key points are at .
Recall the corresponding -values for each -value for both sine and cosine.
Try solving on your own before revealing the answer!
Q2. Modeling Data with Trigonometric Functions
Background
Topic: Trigonometric Models from Data
This question is about fitting trigonometric models to data, identifying amplitude, period, and phase shift, and interpreting the meaning of these parameters in context.
Key Terms and Formulas:
Amplitude:
Vertical Shift:
Period:
Phase Shift:
Step-by-Step Guidance
Identify the maximum and minimum values from the data or graph.
Calculate the amplitude and vertical shift using the formulas above.
Determine the period by finding the distance between repeating points (e.g., peaks).
Find the phase shift by comparing the starting point of the model to the standard parent graph.
Try solving on your own before revealing the answer!
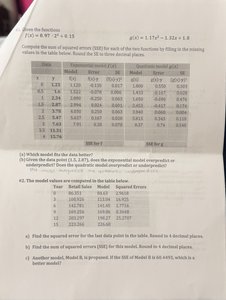
Q3. Sum of Squared Errors (SSE) for Model Comparison
Background
Topic: Error Analysis in Model Fitting
This question asks you to compute the sum of squared errors (SSE) for two models and compare their fit to a data set. SSE is a common metric for quantifying how well a model fits observed data.
Key Terms and Formulas:
Sum of Squared Errors (SSE):
= observed value, = predicted value from the model
Step-by-Step Guidance
For each data point, subtract the model's predicted value from the observed value.
Square each difference to ensure all errors are positive.
Sum all the squared differences to obtain the SSE for each model.
Compare the SSE values: the model with the lower SSE fits the data better.
Try solving on your own before revealing the answer!
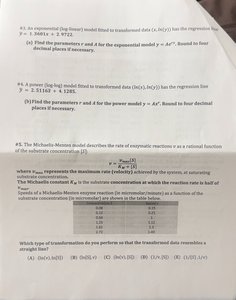
Q4. Fitting Exponential and Power Models to Data
Background
Topic: Nonlinear Regression (Exponential and Power Models)
This question involves fitting exponential and power models to transformed data using regression equations. You are asked to extract parameters from the regression output and write the model in standard form.
Key Terms and Formulas:
Exponential Model:
Power Model:
Regression output often gives or as a linear function of or .
Step-by-Step Guidance
Identify the regression equation provided (e.g., or ).
Recall how to exponentiate both sides to solve for in terms of .
Extract the parameters and from the regression coefficients.
Write the model in the requested form (exponential or power).
Try solving on your own before revealing the answer!
Q5. Michaelis-Menten Model and Data Transformation
Background
Topic: Rational Functions and Data Transformation
This question is about the Michaelis-Menten model, which describes enzyme kinetics as a rational function. You are asked to determine which transformation of the data will linearize the model for easier analysis.
Key Terms and Formulas:
Michaelis-Menten Model:
Linearization: Transforming a nonlinear model into a linear form for regression analysis.
Step-by-Step Guidance
Write the Michaelis-Menten equation and consider possible algebraic manipulations (e.g., taking reciprocals).
Recall that taking the reciprocal of both sides can sometimes linearize rational functions.
Set up the transformed equation and identify the variables that would yield a linear relationship.
Match the transformation to the multiple-choice options provided.
Try solving on your own before revealing the answer!