 Back
BackAbsolute Value, Power, Polynomial, and Rational Functions: Key Concepts and Graphical Analysis
Study Guide - Smart Notes
 Tailored notes based on your materials, expanded with key definitions, examples, and context.
Absolute Value Functions
Definition and Properties
The absolute value function is a piecewise-defined function that measures the distance of a number from zero on the number line. It is defined as:
Definition:
Distance Interpretation: The absolute value gives the distance between and on the number line, always a non-negative value.
Graphical Features
The graph of is a "V" shape with its vertex at the origin (0,0).
The corner point (vertex) is where the graph changes direction.
Transformations (shifts, stretches, reflections) move or reshape the graph, but the corner point remains a key feature for identifying transformations.
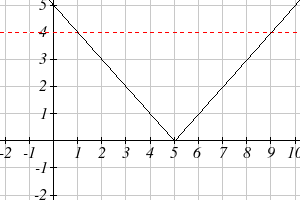
Example: Graph of
This function is shifted right by 5 units. The vertex is at (5,0).
Solving Absolute Value Equations and Inequalities
To solve (where ), set or .
To solve , rewrite as and solve for .
Absolute value inequalities can be solved graphically or by testing intervals.
Example: Graphical Solution of
The solution is the interval .
Power Functions and Polynomial Functions
Power Functions
A power function has the form , where is a nonzero constant and is a real number.
Examples: (quadratic), (cubic), (reciprocal), (square root).
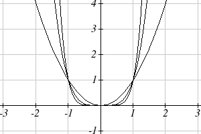
Graphical Behavior of Power Functions
Even powers (, , , ...): Graphs are symmetric about the y-axis and approach infinity as .
Odd powers (, , , ...): Graphs are symmetric about the origin; as , ; as , .
Polynomials
A polynomial is a sum of terms, each a transformed power function with a non-negative integer exponent: .
Degree: The highest power of in the polynomial.
Leading term: The term with the highest degree.
Leading coefficient: The coefficient of the leading term.
Long Run and Short Run Behavior
Long run behavior is determined by the leading term.
Short run behavior includes intercepts and turning points.
A polynomial of degree has at most real zeros and at most turning points.
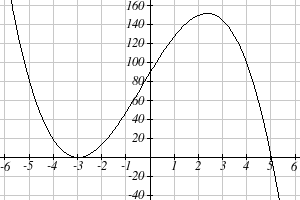
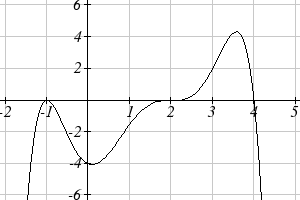
Graphical Behavior at Intercepts
Single zero (multiplicity 1): Graph crosses the axis.
Double zero (multiplicity 2): Graph touches and bounces off the axis.
Triple zero (multiplicity 3): Graph crosses the axis and flattens out.
Rational Functions
Definition and Key Features
A rational function is a ratio of two polynomials: where .
Vertical asymptotes: Occur where and .
Holes: Occur where both and are zero at the same -value (after simplification).
Horizontal asymptotes: Determined by the degrees of and :
If degree of > degree of : is the horizontal asymptote.
If degrees are equal: .
If degree of > degree of : No horizontal asymptote.
Intercepts: Vertical intercept at (if defined); horizontal intercepts where (if not a hole).
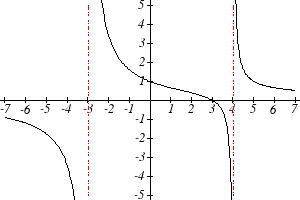
Example: Graph of a Rational Function with Two Vertical Asymptotes
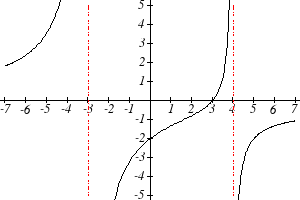
Example: Graph of a Rational Function with a Double Zero and Asymptotes
Behavior Near Asymptotes and Intercepts
At a vertical asymptote with an odd power, the function approaches on one side and on the other.
At a vertical asymptote with an even power, the function approaches the same infinity on both sides.
At a double zero (multiplicity 2), the graph bounces off the x-axis.
Summary Table: Polynomial and Rational Function Features
Feature | Polynomial | Rational Function |
|---|---|---|
Definition | Sum of power functions with non-negative integer exponents | Ratio of two polynomials |
Long Run Behavior | Determined by leading term | Determined by ratio of leading terms |
Intercepts | At most degree many x-intercepts | Numerator zeros: x-intercepts; denominator zeros: vertical asymptotes |
Asymptotes | None | Vertical and horizontal (or slant) asymptotes possible |
Key Takeaways
Absolute value functions model distance and are solved using piecewise definitions.
Power and polynomial functions are classified by degree and leading coefficient, which determine their end behavior.
Rational functions introduce asymptotes and holes, with behavior determined by the degrees and factors of numerator and denominator.
Graphical analysis is essential for understanding intercepts, turning points, and asymptotic behavior.
