 Back
BackAnalyzing Basic Functions: Key Properties and Graphs
Study Guide - Smart Notes
 Tailored notes based on your materials, expanded with key definitions, examples, and context.
Q1. Analyze the properties of a basic function using its graph.
Background
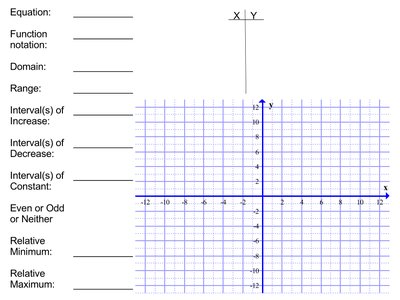
Topic: Basic Functions and Their Graphs
This question is testing your ability to identify and describe key properties of basic functions, such as their domain, range, intervals of increase/decrease/constant, and whether they are even, odd, or neither. These are foundational concepts in college algebra, helping you understand how functions behave and how to interpret their graphs.
Key Terms and Formulas:
Domain: The set of all possible input values () for the function.
Range: The set of all possible output values () for the function.
Intervals of Increase: Where the function's output () increases as increases.
Intervals of Decrease: Where the function's output () decreases as increases.
Intervals of Constant: Where the function's output () remains unchanged as increases.
Even Function: for all in the domain.
Odd Function: for all in the domain.
Relative Minimum/Maximum: The lowest/highest point in a particular interval of the function.
Step-by-Step Guidance
Identify the equation of the function based on the graph or given information. For example, if the graph is a straight horizontal line, it may represent a constant function such as .
Write the function in proper notation, such as for a quadratic function or for the identity function.
Determine the domain by considering all possible values for which the function is defined. For most basic functions, the domain is all real numbers (), but for functions like , the domain is .
Determine the range by considering all possible values the function can take. For example, has a range of .
Analyze the intervals where the function increases, decreases, or remains constant by observing the slope and shape of the graph.
Try solving on your own before revealing the answer!
