 Back
Analyzing Functions and Their Graphs – College Algebra Guidance
Study Guide - Smart Notes
 Tailored notes based on your materials, expanded with key definitions, examples, and context.
Q51. Analyze the function shown in the graph below:
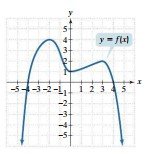
Background
Topic: Graphs of Functions, Increasing/Decreasing Intervals, Relative Extrema
This question tests your ability to interpret a function's graph to determine its domain, range, zeros, intercepts, intervals of increase/decrease, and relative extrema.
Key Terms and Concepts:
Domain: All possible -values for which is defined.
Range: All possible -values that attains.
Zeros: -values where (where the graph crosses the -axis).
Intercepts: -intercepts (where ), -intercept (where ).
Increasing/Decreasing Intervals: Where the graph rises or falls as increases.
Relative Maximum/Minimum: Highest/lowest points in a local region of the graph.
Step-by-Step Guidance
Domain: Look at the leftmost and rightmost -values where the graph exists. Write the interval for .
Range: Identify the lowest and highest -values the graph reaches. Express this as an interval for .
Zeros of : Find all -values where the graph crosses the -axis (i.e., ).
: Locate the point where and read the corresponding -value (the -intercept).
Intervals of Increase/Decrease: Observe where the graph moves upward (increasing) or downward (decreasing) as you move from left to right. Identify the -intervals for each behavior.
Values of for which : Find the intervals where the graph is on or below the -axis.
Relative Maxima: Identify any peaks (highest points in a local region) and the -values where they occur.
Value of for which : Find where the graph reaches and note the corresponding -value(s).
Sign of : Check the -value at to determine if it is positive or negative.
Try solving on your own before revealing the answer!
Final Answers:
a. Domain:
b. Range:
c. Zeros of :
d. :
e. Increasing on: and
f. Decreasing on: and
g. for:
h. Relative maxima at: (maximum value ), (maximum value )
i. at: and
j. is positive.
Each answer is found by carefully reading the graph and applying the definitions above.
Q52. Analyze the function shown in the graph below:
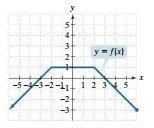
Background
Topic: Piecewise Functions, Graph Interpretation
This question tests your ability to interpret a piecewise function's graph to determine domain, range, zeros, intercepts, intervals of increase/decrease/constant, and other properties.
Key Terms and Concepts:
Piecewise Function: A function defined by different expressions over different intervals.
Domain/Range: As above.
Zeros: -values where .
Intercepts: Where the graph crosses the axes.
Intervals of Increase/Decrease/Constant: Where the graph rises, falls, or stays flat.
Sign of : Whether is positive, negative, or zero for given .
Even/Odd/Neither: Even: ; Odd: .
Step-by-Step Guidance
Domain: Identify the leftmost and rightmost -values where the graph exists.
Range: Find the lowest and highest -values the graph attains.
Zeros of : Find all -values where the graph crosses the -axis.
: Read the -value at .
Intervals of Increase/Decrease/Constant: Identify where the graph rises, falls, or is flat as increases.
Values of for which : Find intervals where the graph is above the -axis.
Values of for which : Find -values where the graph is at .
Sign of : Check the -value at to see if it is positive or negative.
Even, Odd, or Neither: Compare and for symmetry.
Is a relative maximum? Check if is higher than nearby points.
Try solving on your own before revealing the answer!
Final Answers:
a. Domain:
b. Range:
c. Zeros of :
d. :
e. Increasing on:
f. Decreasing on:
g. Constant on:
h. for:
i. at: and
j. is negative.
k. Even function.
l. is not a relative maximum.
Answers are based on careful reading of the graph and definitions above.
