 Back
BackAnalyzing Maximum and Minimum Temperatures from a Line Graph
Study Guide - Smart Notes
 Tailored notes based on your materials, expanded with key definitions, examples, and context.
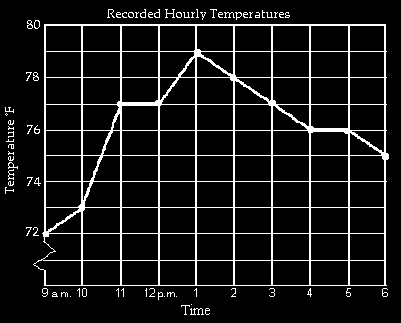
Q32. At what time was the temperature its lowest?
Background
Topic: Reading and interpreting graphs
This question tests your ability to analyze a line graph and identify the minimum value of a variable (temperature) over a given time interval.
Key Terms:
Minimum value: The lowest point on the graph, representing the smallest temperature recorded.
Time axis: The horizontal axis, showing the hours of the day.
Temperature axis: The vertical axis, showing the temperature in degrees Fahrenheit.
Step-by-Step Guidance
Examine the graph and identify the points where the temperature is plotted for each hour.
Look for the point on the graph that is at the lowest vertical position (closest to the bottom of the temperature axis).
Read the corresponding time from the horizontal axis for this lowest point.
Double-check by comparing all other points to ensure this is indeed the minimum temperature.
Try solving on your own before revealing the answer!
Final Answer: 9 a.m.
The lowest temperature on the graph occurs at 9 a.m., where the temperature is at its minimum value.
Q50. At what time was the temperature the highest?
Background
Topic: Reading and interpreting graphs
This question tests your ability to analyze a line graph and identify the maximum value of a variable (temperature) over a given time interval.
Key Terms:
Maximum value: The highest point on the graph, representing the largest temperature recorded.
Time axis: The horizontal axis, showing the hours of the day.
Temperature axis: The vertical axis, showing the temperature in degrees Fahrenheit.
Step-by-Step Guidance
Examine the graph and identify the points where the temperature is plotted for each hour.
Look for the point on the graph that is at the highest vertical position (closest to the top of the temperature axis).
Read the corresponding time from the horizontal axis for this highest point.
Double-check by comparing all other points to ensure this is indeed the maximum temperature.

Try solving on your own before revealing the answer!
Final Answer: 1 p.m.
The highest temperature on the graph occurs at 1 p.m., where the temperature is at its maximum value.
