 Back
Chapter 1: Graphs, Functions, and Models – College Algebra Study Notes
Study Guide - Smart Notes
 Tailored notes based on your materials, expanded with key definitions, examples, and context.
Graphs, Functions, and Models
Introduction to Graphing
The Cartesian coordinate system is fundamental in College Algebra for visualizing equations and their solutions. Understanding how to plot points and interpret ordered pairs is essential for graphing equations and analyzing their properties.
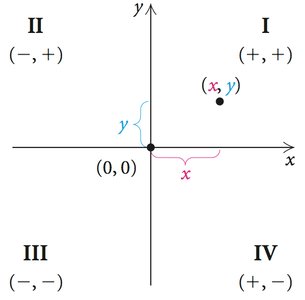
Plotting Points: Each point in the plane is represented by an ordered pair (x, y). The x-coordinate indicates horizontal movement from the origin, while the y-coordinate indicates vertical movement.
Quadrants: The plane is divided into four quadrants, each defined by the signs of x and y.
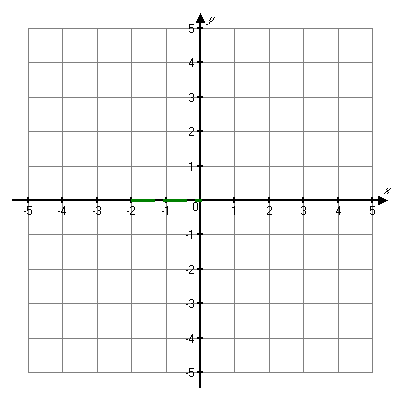
Example: To plot (−3, 5), move 3 units left and 5 units up from the origin.
Solutions of Equations in Two Variables
Equations involving two variables, such as x and y, have solutions that are ordered pairs. Substituting values into the equation determines whether the pair is a solution.
Definition: A solution to an equation in two variables is an ordered pair (x, y) that makes the equation true.
Example: For , (−5, 7) is not a solution, but (3, 4) is.
Graphing Equations
Graphing an equation means drawing all points (x, y) that satisfy the equation. This visual representation helps identify intercepts and other key features.
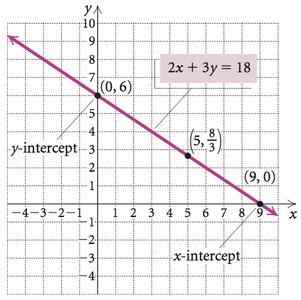
x-Intercept: The point where the graph crosses the x-axis, found by setting y = 0.
y-Intercept: The point where the graph crosses the y-axis, found by setting x = 0.
Example: For , the x-intercept is (9, 0) and the y-intercept is (0, 6).
Additional Point: Substitute x = 5 to find another solution: , so the point is .
Graphing Quadratic Equations
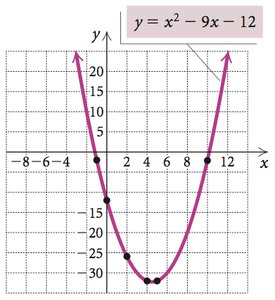
Quadratic equations, such as , produce parabolic graphs. Creating a table of values helps plot the curve accurately.
Definition: A quadratic equation is any equation of the form .
Example: For , calculate y for various x-values and plot the points.
The Distance Formula
The distance between two points in the plane is calculated using the Pythagorean theorem. This formula is essential for measuring lengths and analyzing geometric relationships.
Formula:
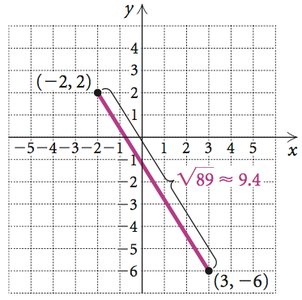
Example: The distance between (−2, 2) and (3, −6) is .
The Midpoint Formula
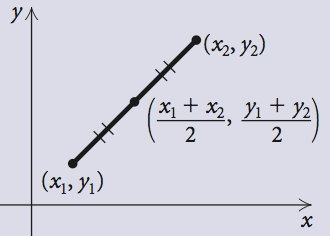
The midpoint of a segment connecting two points is found by averaging their coordinates. This is useful for bisecting lines and finding centers.
Formula:
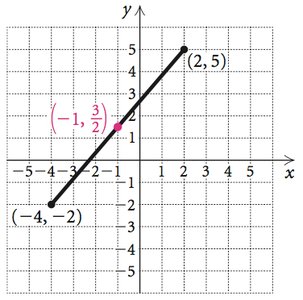
Example: The midpoint between (−4, −2) and (2, 5) is .
Equations of Circles
A circle is defined as the set of all points a fixed distance (radius) from a center point. The standard equation of a circle is derived from the distance formula.
Standard Form:
Example: A circle with center (3, −7) and radius 5 has the equation .
