 Back
BackChapter 2: Analyzing Graphs of Functions – College Algebra Study Notes
Study Guide - Smart Notes
 Tailored notes based on your materials, expanded with key definitions, examples, and context.
Section 2.2: Analyzing Graphs of Functions
Zeros of Linear Functions
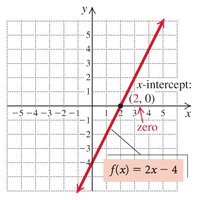
The zero of a function is an input value c for which the output of the function is zero, i.e., f(c) = 0. Zeros are also known as x-intercepts of the graph of the function. For linear functions, there is at most one zero.
Definition: If f(c) = 0, then c is a zero of f.
Graphical Interpretation: The zero corresponds to the point where the graph crosses the x-axis.
Example: For f(x) = 2x - 4, the zero is found by solving 2x - 4 = 0, which gives x = 2.
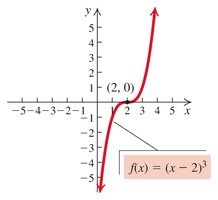
Example: For f(x) = (x - 2)^3, the zero is at x = 2.
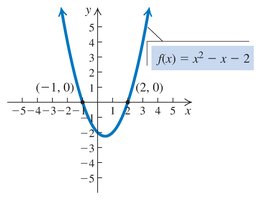
Example: For f(x) = x^2 - x - 2, the zeros are at x = -1 and x = 2.
Increasing, Decreasing, and Constant Functions
A function can be classified as increasing, decreasing, or constant on intervals of its domain. These classifications describe how the output values change as the input values increase.
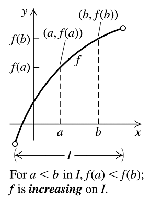
Increasing: A function f is increasing on interval I if for all a, b in I with a < b, f(a) < f(b).
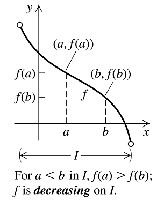
Decreasing: A function f is decreasing on interval I if for all a, b in I with a < b, f(a) > f(b).
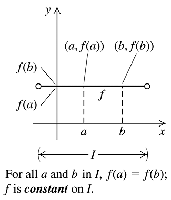
Constant: A function f is constant on interval I if for all a, b in I, f(a) = f(b).
Example: Identifying Intervals of Increase, Decrease, and Constancy
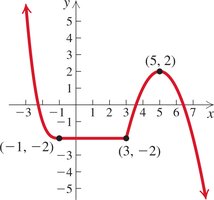
Given a function's graph, you can determine the intervals where it is increasing, decreasing, or constant by observing the direction of the curve.
Increasing: The function is increasing on the interval (3, 5) where the y-values rise as x increases.
Decreasing: The function is decreasing on the intervals (-∞, -1) and (5, ∞) where the y-values fall as x increases.
Constant: The function is constant on the interval (-1, 3) where the y-value remains unchanged.
Relative Maximum and Minimum Values
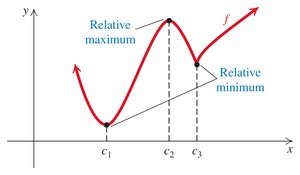
A function may have points where it reaches a local highest or lowest value, called relative maximum and relative minimum respectively. These are important for understanding the behavior of functions and for applications.
Relative Maximum: f(c) is a relative maximum if there exists an open interval I containing c such that f(c) > f(x) for all x in I where x ≠ c.
Relative Minimum: f(c) is a relative minimum if there exists an open interval I containing c such that f(c) < f(x) for all x in I where x ≠ c.
Applications of Functions: Maximizing Area
Functions are often used to model real-world situations, such as maximizing or minimizing quantities. For example, finding the maximum area that can be enclosed with a fixed length of partition.
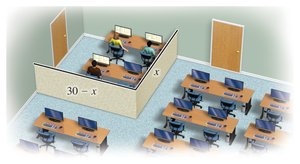
Problem: A college has 30 ft of dividers to form two sides of a rectangular testing center. If x is the length, then the width is 30 - x.
Area Function: The area A(x) is given by A(x) = x(30 - x).
Domain: 0 < x < 30 (since both sides must be positive).
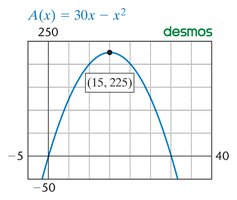
Graph: The graph of A(x) = 30x - x^2 is a downward-opening parabola, with a maximum at x = 15.
Example: The maximum area is at x = 15, A(15) = 225 square feet.
Formula:
Area function:
Maximum area at
Maximum value:
Summary Table: Types of Function Behavior
Type | Definition | Graphical Feature |
|---|---|---|
Zero | f(c) = 0 | x-intercept |
Increasing | f(a) < f(b) for a < b | Upward slope |
Decreasing | f(a) > f(b) for a < b | Downward slope |
Constant | f(a) = f(b) for all a, b | Horizontal line |
Relative Maximum | f(c) > f(x) near c | Local peak |
Relative Minimum | f(c) < f(x) near c | Local valley |
Additional info: Academic context and examples were expanded for clarity and completeness.
