 Back
College Algebra Exam 1 Review – Step-by-Step Study Guidance
Study Guide - Smart Notes
 Tailored notes based on your materials, expanded with key definitions, examples, and context.
Q1. Matching: Match the formulas and concepts.
Background
Topic: Fundamental Algebraic Concepts
This question tests your understanding of key formulas and concepts in College Algebra, such as function types, slope formulas, sequence formulas, and the quadratic formula.
Key Terms and Formulas:
Even Function:
Odd Function:
Slope Formula:
Quadratic Formula:
Arithmetic Sequence:
Geometric Sequence:
Point-Slope Form:
Slope-Intercept Form:
Average Rate of Change:
Function Composition:
Step-by-Step Guidance
Review each formula and concept listed in the question.
Recall the definition or property associated with each term (e.g., what makes a function even or odd).
Match each formula to its corresponding concept by identifying the formula's structure and purpose.
For sequence formulas, distinguish between arithmetic (addition/subtraction) and geometric (multiplication/division).
For slope-related concepts, remember the difference between parallel (same slope) and perpendicular (negative reciprocal slope).
Try solving on your own before revealing the answer!
Final Answer:
Even Function: a)
Odd Function: f)
Function Composition: g)
Average Rate of Change: h)
Point-Slope Form: i)
Slope Formula: b)
Slope-Intercept Form: l)
Arithmetic Sequence Formula: e)
Geometric Sequence Formula: j)
Parallel Slope: k) Same Slope
Perpendicular Slope: d) Negative Reciprocal Slope
Quadratic Formula: c)
Matching these formulas to their concepts is foundational for College Algebra problem-solving.
Q2. Give the domain and range of the relations and determine if the relations are functions.
Background
Topic: Relations and Functions
This question tests your ability to identify the domain and range of a set of ordered pairs and determine whether the relation is a function.
Key Terms:
Domain: The set of all possible input values (x-values).
Range: The set of all possible output values (y-values).
Function: A relation in which each input has exactly one output.
Step-by-Step Guidance
List all x-values from the given set to determine the domain.
List all y-values from the given set to determine the range.
Check if any x-value is repeated with different y-values. If so, the relation is not a function.
For each part, organize the values and check for uniqueness in the x-values.
Try solving on your own before revealing the answer!
Final Answer:
a. Domain = {9, 6, 12}; Range = {-6, 1, -5, -4}. Not a function (12 is paired with two different y-values).
b. Domain = {-4, -3, 0, 3, 5}; Range = {21, 14, 5, 30}. Is a function (each x-value is unique).
Functions require each input to have only one output. Repeated x-values with different y-values indicate a relation is not a function.
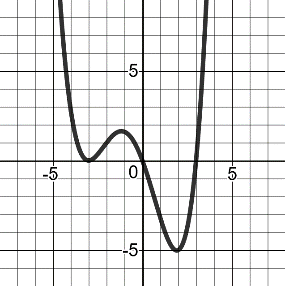
Q3. Use the graph to determine the function’s domain and range. State x and y-intercepts. Find the indicated values.
Background
Topic: Graph Analysis
This question tests your ability to interpret a graph to find domain, range, intercepts, and specific function values.
Key Terms:
Domain: All x-values for which the function is defined.
Range: All y-values the function attains.
x-intercept: Where the graph crosses the x-axis ().
y-intercept: Where the graph crosses the y-axis ().
Function value: is the y-value when .
Step-by-Step Guidance
Examine the graph to identify the domain (horizontal extent) and range (vertical extent).
Locate points where the graph crosses the axes for intercepts.
To find , locate on the graph and read the corresponding y-value.
Write down the domain and range using interval notation.
Identify all intercepts and set up the values to be found.
Try solving on your own before revealing the answer!
Final Answer:
a. Domain: ; Range: ; x-intercepts: ; y-intercept: ; ,
b. Domain: ; Range: ; x-intercept: ; y-intercept: ; ,
Reading values from the graph is a key skill for understanding function behavior.
Q4. Identify the intervals where the function is increasing, decreasing, and constant. Locate any relative maxima or minima.
Background
Topic: Function Behavior from Graphs
This question tests your ability to analyze a graph to determine where a function is increasing, decreasing, or constant, and to find relative extrema.
Key Terms:
Increasing: Function values rise as x increases.
Decreasing: Function values fall as x increases.
Constant: Function values stay the same as x increases.
Relative Maximum: Highest point in a local region.
Relative Minimum: Lowest point in a local region.
Step-by-Step Guidance
Examine the graph and identify intervals where the curve moves upward (increasing), downward (decreasing), or stays flat (constant).
Mark the x-values where the behavior changes.
Locate peaks (relative maxima) and valleys (relative minima) on the graph.
Write the intervals using proper notation.
Set up the points for maxima and minima based on the graph's turning points.
Try solving on your own before revealing the answer!
Final Answer:
a. Increasing: ; Decreasing: ; Constant: ; Relative Maxima: ; Relative Minima:
b. Increasing: ; Decreasing: ; Constant: ; Relative Maxima: None; Relative Minima:
Identifying these intervals helps describe the function's overall behavior.
Q5. Determine whether the given functions are even, odd, or neither. Show steps using .
Background
Topic: Symmetry of Functions
This question tests your ability to classify functions as even, odd, or neither by evaluating and comparing it to and .
Key Terms:
Even Function: (symmetric about the y-axis)
Odd Function: (symmetric about the origin)
Neither: Does not satisfy either property
Step-by-Step Guidance
For each function, substitute for to find .
Compare to and to determine symmetry.
If , the function is even; if , it is odd; otherwise, it is neither.
Show your algebraic steps for each function.
Try solving on your own before revealing the answer!
Final Answer:
a. is odd.
b. is even.
c. is neither.
Substituting and comparing to and reveals the function's symmetry.
