 Back
BackCollege Algebra Exam Study Guide: Quadratics, Polynomials, and Variation
Study Guide - Smart Notes
 Tailored notes based on your materials, expanded with key definitions, examples, and context.
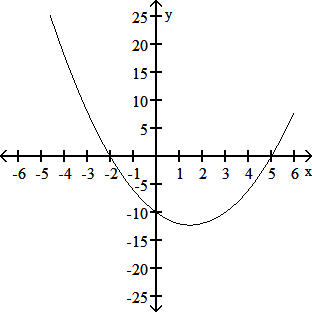
Q8. Use the given graph to find the x-intercepts and zeros of the function.
Background
Topic: Quadratic Functions and Graphs
This question tests your ability to interpret the graph of a quadratic function, specifically to identify the x-intercepts (also called zeros or roots) where the graph crosses the x-axis.
Key Terms and Concepts:
x-intercept: The point(s) where the graph crosses the x-axis (y = 0).
Zero of a function: The value(s) of x for which f(x) = 0.
Step-by-Step Guidance
Look at the graph and identify the points where the curve crosses the x-axis. These are the x-intercepts.
Read the x-coordinates of these intersection points. These values are the zeros of the function.
Write the zeros as ordered pairs (x, 0) and also list the x-values alone as the zeros.
Try solving on your own before revealing the answer!
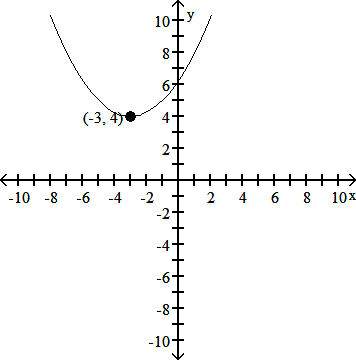
Q19. Use the graph to find the vertex, the axis of symmetry, and the maximum or minimum value of the function.
Background
Topic: Quadratic Functions and Their Properties
This question asks you to analyze a parabola to find its vertex, axis of symmetry, and whether it has a maximum or minimum value. These are key features of quadratic functions.
Key Terms and Concepts:
Vertex: The highest or lowest point on the parabola (maximum or minimum).
Axis of symmetry: The vertical line that passes through the vertex and divides the parabola into two mirror images. Its equation is x = h, where (h, k) is the vertex.
Maximum/Minimum value: The y-value of the vertex. If the parabola opens upward, it's a minimum; if downward, it's a maximum.
Step-by-Step Guidance
Locate the vertex on the graph. This is the point where the parabola changes direction.
Read the coordinates of the vertex (h, k) directly from the graph.
The axis of symmetry is the vertical line x = h, where h is the x-coordinate of the vertex.
Determine if the parabola opens upward (minimum) or downward (maximum) by observing the direction of the arms.
The maximum or minimum value is the y-coordinate of the vertex.
Try solving on your own before revealing the answer!
Q24. Graph the function f(x) = 3x^2 + 2x - 5.
Background
Topic: Graphing Quadratic Functions
This question asks you to graph a quadratic function. Understanding how to plot the vertex, axis of symmetry, and intercepts is essential for accurately sketching the graph.
Key Terms and Concepts:
Quadratic function: A function of the form f(x) = ax^2 + bx + c.
Vertex: The point (h, k) where the function reaches its maximum or minimum.
Axis of symmetry: The line x = h that divides the parabola into two symmetric parts.
y-intercept: The point where the graph crosses the y-axis (x = 0).
Step-by-Step Guidance
Identify the coefficients: a = 3, b = 2, c = -5.
Find the vertex using the formula .
Calculate the y-coordinate of the vertex by plugging the x-value into the function.
Find the y-intercept by evaluating f(0).
Plot the vertex, y-intercept, and a few additional points on both sides of the vertex to sketch the parabola.
Try solving on your own before revealing the answer!
