 Back
BackCollege Algebra Final Exam Review – Step-by-Step Guidance
Study Guide - Smart Notes
 Tailored notes based on your materials, expanded with key definitions, examples, and context.
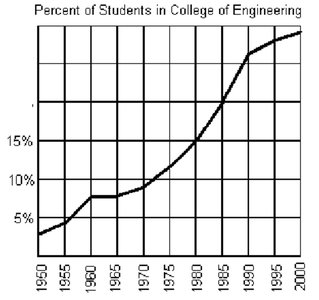
Q2. The graph below shows the percentage of students enrolled in the College of Engineering at Stale University. Use the graph to answer the following:
a. Does the graph represent a function?
b. If f represents the function, find f(1995).
c. If f(x) = 12%, what year is represented by x?
Background
Topic: Functions and Graph Interpretation
This question tests your understanding of functions, how to interpret graphs, and how to extract information from a graph. You will need to determine if the graph represents a function, evaluate the function at a specific input, and find the input that corresponds to a given output.
Key Terms and Concepts:
Function: A relation where each input (x-value) has exactly one output (y-value).
f(x): Function notation, where x is the input (often a year in this context) and f(x) is the output (percentage of students).
Graph Interpretation: Reading values from a graph by locating the appropriate x or y value.
Step-by-Step Guidance
For part (a), recall the definition of a function: for each x-value (year), there should be only one corresponding y-value (percentage). Check the graph to see if any vertical line would intersect the curve more than once.
For part (b), to find f(1995), locate the year 1995 on the x-axis and move vertically to the curve. Then, read the corresponding y-value (percentage) from the y-axis.
For part (c), to find the year when f(x) = 12%, locate 12% on the y-axis and move horizontally to the curve. Then, drop down to the x-axis to find the corresponding year.
Try solving on your own before revealing the answer!
Final Answers:
a. Yes, the graph represents a function because each year corresponds to only one percentage value.
b. f(1995) = 19% (from the graph, the percentage in 1995 is about 19%).
c. f(x) = 12% corresponds to the year 1980 (from the graph, 12% occurs around 1980).
Each part involves interpreting the graph and applying the definition of a function.
