 Back
BackCollege Algebra Final Exam Review – Step-by-Step Guidance
Study Guide - Smart Notes
 Tailored notes based on your materials, expanded with key definitions, examples, and context.
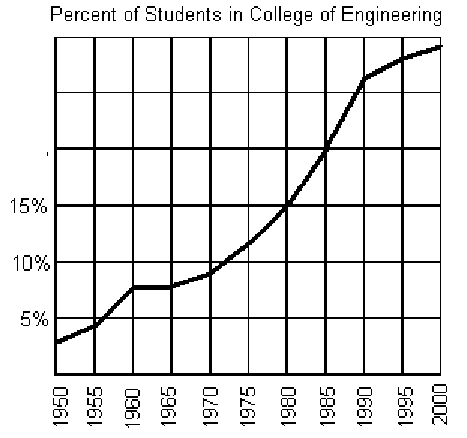
Q2. The graph below shows the percentage of students enrolled in the College of Engineering at Stale University. Use the graph to answer the following:
a. Does the graph represent a function?
b. If f represents the function, find f(1995).
c. If f(x) = 12%, what year is represented by x?
Background
Topic: Functions and Graphs
This question tests your understanding of functions, how to interpret graphs, and how to use function notation to extract information from a graph.
Key Terms:
Function: A relation in which each input (x-value) has exactly one output (y-value).
Function Notation: represents the output value for a given input .
Domain: The set of all possible input values (years, in this case).
Range: The set of all possible output values (percentages).
Step-by-Step Guidance
To determine if the graph represents a function, check if each year (x-value) corresponds to only one percentage (y-value). This is often called the "vertical line test." If any vertical line crosses the graph more than once, it is not a function.
For part (b), locate the year 1995 on the x-axis and find the corresponding y-value (percentage) on the graph. This value is .
For part (c), find the year where the percentage of students enrolled is 12%. Look for the point on the graph where the y-value is 12%, and identify the corresponding x-value (year).
Try solving on your own before revealing the answer!
Final Answer:
a. Yes, the graph represents a function because each year corresponds to only one percentage.
b. (from the graph).
c. corresponds to the year .
Each part uses the graph to match input (year) to output (percentage), demonstrating function concepts.
