 Back
BackCollege Algebra: Foundational Concepts, Linear and Exponential Functions, and Graphical Analysis
Study Guide - Smart Notes
 Tailored notes based on your materials, expanded with key definitions, examples, and context.
Review of Algebra
Order of Operations and Basic Skills
Understanding the order of operations is essential for simplifying algebraic expressions. The standard order is Parentheses, Exponents, Multiplication/Division (from left to right), Addition/Subtraction (from left to right), often abbreviated as PEMDAS. Combining like terms and using the distributive property are foundational skills for manipulating algebraic expressions.
Combine Like Terms: Add or subtract coefficients of terms with the same variable and exponent.
Distributive Property: For any numbers a, b, and c:
FOIL Method: Used for multiplying two binomials:
Example: Simplify
Factoring
Factoring is the process of expressing a polynomial as a product of its factors. Common methods include factoring out the greatest common factor, factoring the difference of squares, and factoring trinomials.
Difference of Squares:
Factoring Trinomials: can often be factored as where and are numbers that multiply to and add to .
Example:
Functions
Definition and Notation
A function is a relation in which each input (independent variable, usually x) has exactly one output (dependent variable, usually y). Function notation is written as , where names the function.
Example: If , then
Important: does not mean times ; it means the value of function $f$ at $x$.
Domain and Range
The domain of a function is the set of all possible input values (x-values), and the range is the set of all possible output values (y-values). Interval notation is used to describe these sets.
Closed Interval: includes endpoints and .
Open Interval: excludes endpoints.
Half-Open: or includes one endpoint.
Example: If a function is defined for and , the domain is .
Graphs of Equations and Functions
Visualizing Functions
Graphs are essential for understanding the behavior of functions. Key features include intervals where the function is increasing, decreasing, or constant, as well as intercepts and asymptotes.
Increasing: increases as increases.
Decreasing: decreases as increases.
Constant: remains the same as increases.
Zero Output: at x-intercepts.
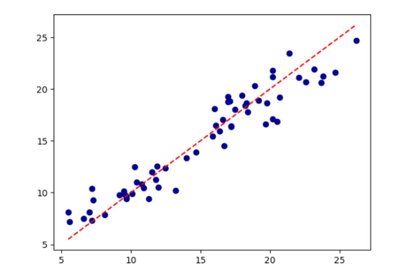
Example: Linear Regression and Scatterplots
Linear regression is used to model the relationship between two variables by fitting a straight line to data points. The regression line represents the best linear approximation of the data.
Equation of a Line: , where is the slope and is the y-intercept.
Interpretation: The slope indicates the average rate of change; the y-intercept is the value when .
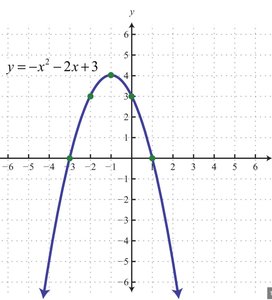
Example: Quadratic Functions
A quadratic function has the form . Its graph is a parabola, which opens upward if and downward if . The vertex is the maximum or minimum point, and the axis of symmetry passes through the vertex.
Vertex:
Example: is a downward-opening parabola with vertex at .
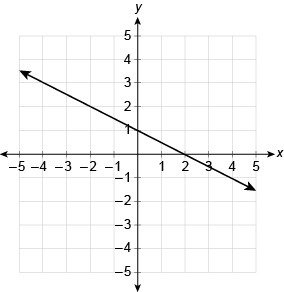
Example: Linear Functions
Linear functions are graphed as straight lines. The slope determines the steepness and direction, while the y-intercept is where the line crosses the y-axis.
Positive Slope: Line rises from left to right.
Negative Slope: Line falls from left to right.
Zero Slope: Horizontal line.
Undefined Slope: Vertical line.
Example: The line has a negative slope and crosses the y-axis at .
Exponents and Logarithms
Properties of Exponents
Exponents indicate repeated multiplication. Key properties include:
Product Rule:
Quotient Rule:
Power Rule:
Negative Exponent:
Zero Exponent: (for )
Logarithms
The logarithm is the inverse of the exponential function. For , . Properties include:
Product:
Quotient:
Power:
Change of Base:
Linear and Exponential Models
Linear Models
Linear models describe relationships with a constant rate of change. The general form is .
Application: Population growth by a fixed amount each year, depreciation of an asset, etc.
Exponential Models
Exponential models describe situations where the rate of change is proportional to the current value. The general form is , where is the initial value and is the growth (or decay) factor.
Growth:
Decay:
Continuous Growth/Decay: , where is the continuous rate.
Summary Table: Key Properties of Linear and Exponential Functions
Property | Linear Function | Exponential Function |
|---|---|---|
General Form | ||
Rate of Change | Constant (slope ) | Proportional to current value |
Graph | Straight line | Curve (increasing or decreasing) |
Applications | Depreciation, salary increase | Population growth, radioactive decay |
