 Back
BackCollege Algebra: Graphs, Functions, and Models – Study Notes
Study Guide - Smart Notes
 Tailored notes based on your materials, expanded with key definitions, examples, and context.
Chapter 1: Graphs, Functions, and Models
Introduction to Graphing
Graphing is a foundational skill in algebra, allowing us to visualize equations, functions, and data. The Cartesian coordinate system is used to plot points, graph equations, and analyze relationships between variables.
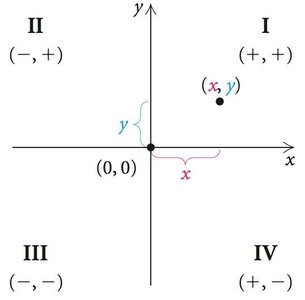
Cartesian Coordinate System: Consists of two perpendicular axes (x-axis and y-axis) intersecting at the origin (0, 0). The plane is divided into four quadrants.
Plotting Points: An ordered pair (x, y) locates a point by moving x units left/right and y units up/down from the origin.
Solutions of Equations: An ordered pair (x, y) is a solution to an equation in two variables if substituting x and y yields a true statement.
Graph of an Equation: The set of all solutions plotted in the coordinate plane forms the graph of the equation.
x-Intercept: The point where the graph crosses the x-axis (y = 0).
y-Intercept: The point where the graph crosses the y-axis (x = 0).
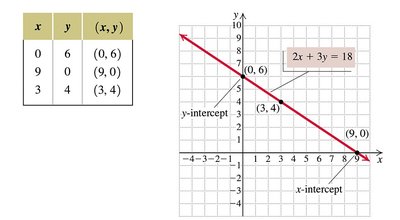
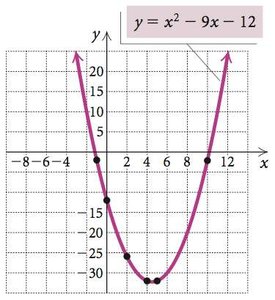
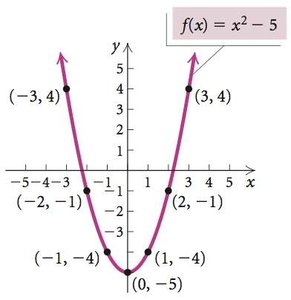
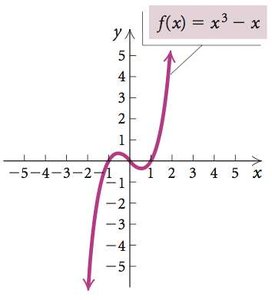
Graphing Nonlinear Equations: For equations not in the form Ax + By = C, such as quadratics, plot several points and connect them smoothly.
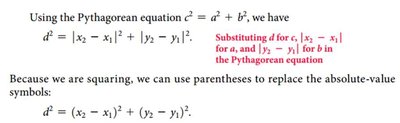
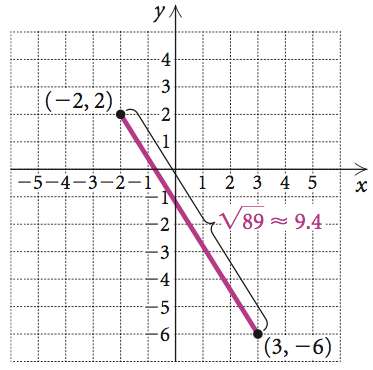
Distance Formula: The distance between points (x₁, y₁) and (x₂, y₂) is given by:
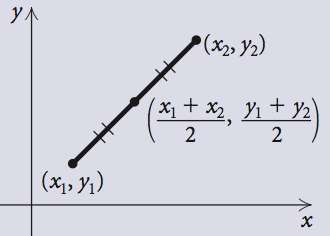
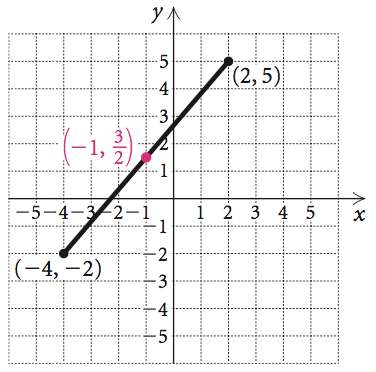
Midpoint Formula: The midpoint of a segment with endpoints (x₁, y₁) and (x₂, y₂) is:
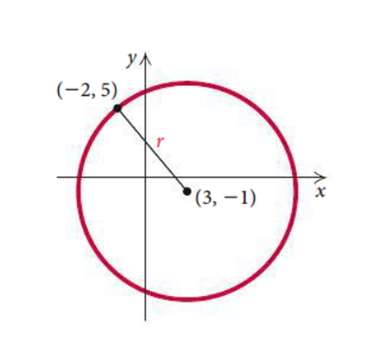
Equation of a Circle: A circle with center (h, k) and radius r has the equation:
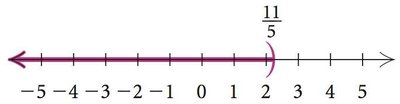
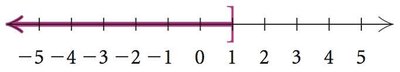
Solving Linear Inequalities
Linear inequalities are statements involving <, >, ≤, or ≥. The solution set consists of all values making the inequality true.
Addition Principle: Adding the same value to both sides preserves the inequality.
Multiplication Principle: Multiplying both sides by a positive number preserves the inequality; multiplying by a negative reverses the sign.
Compound Inequalities: Combine two inequalities with 'and' (conjunction) or 'or' (disjunction).
Chapter 2: More on Functions
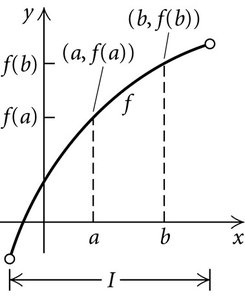
Increasing, Decreasing, and Constant Functions
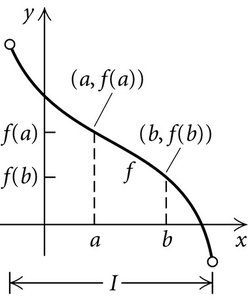
Functions can be classified by their behavior over intervals:
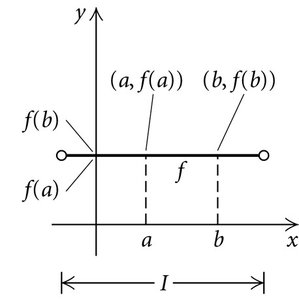
Increasing: for in interval I.
Decreasing: for in interval I.
Constant: for all in interval I.
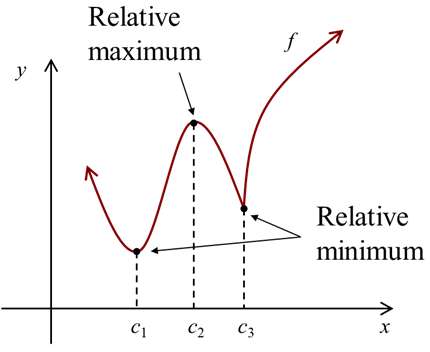
Relative Maximum/Minimum: A function value is a relative maximum if it is greater than all nearby values; a relative minimum if it is less than all nearby values.
Piecewise Functions
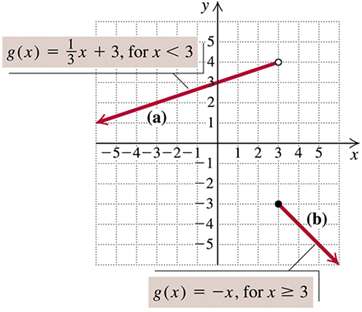
Piecewise functions are defined by different expressions over different intervals of the domain.
Evaluate by determining which interval the input belongs to and using the corresponding formula.
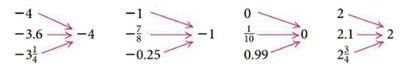
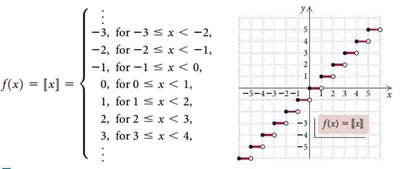
Greatest Integer Function
The greatest integer function, , returns the largest integer less than or equal to x. Its graph is a step function.
Functions and Graphs
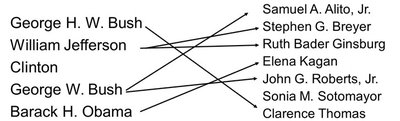
Definition of a Function
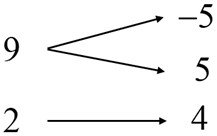
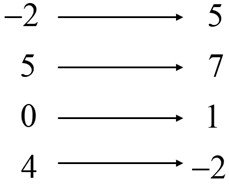
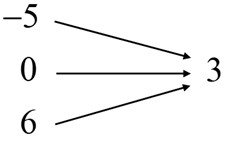
A function is a correspondence between a domain and a range such that each input has exactly one output.
Relation: Any correspondence between two sets; not all relations are functions.
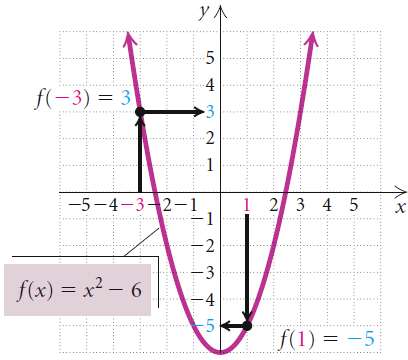
Function Notation: denotes the output for input x.
Graphing Functions
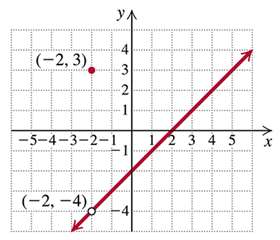
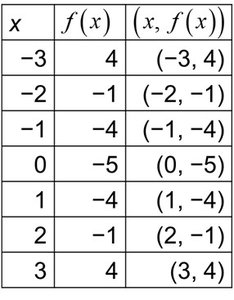
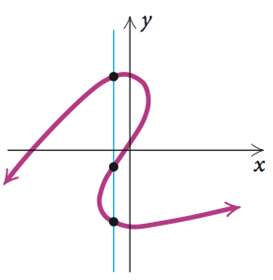
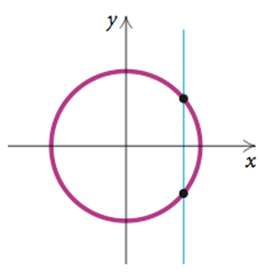
To graph a function, plot points (x, f(x)) and connect them smoothly. The vertical-line test determines if a graph represents a function: if any vertical line crosses the graph more than once, it is not a function.

Domain and Range
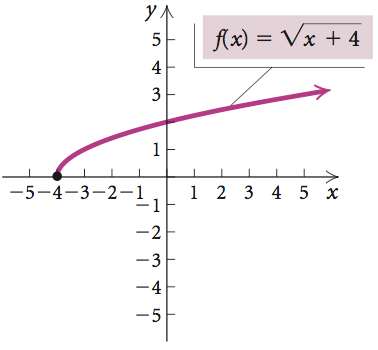
The domain is the set of all possible inputs (x-values); the range is the set of all possible outputs (y-values). For rational and radical functions, exclude values that make the denominator zero or the radicand negative.
Linear Functions, Slope, and Applications
Linear Functions
A linear function has the form , where m is the slope and b is the y-intercept.
Slope: measures the steepness of a line.
Horizontal Lines: (slope 0).
Vertical Lines: (not a function; slope undefined).
Equations of Lines
Slope-Intercept Form:
Point-Slope Form:
Parallel Lines: Same slope, different y-intercepts.
Perpendicular Lines: Slopes are negative reciprocals.
Algebra of Functions
Operations with Functions
Sum:
Difference:
Product:
Quotient: ,
Difference Quotient
The difference quotient is used to compute the average rate of change of a function:
Composition and Decomposition of Functions
Composition of Functions
The composition is defined as . The domain consists of all x in the domain of g such that is in the domain of f.
Decomposition:
Expressing a function as a composition of two or more simpler functions.
Symmetry, Even and Odd Functions
Symmetry
x-axis: Replace y with –y; if equivalent, symmetric about x-axis.
y-axis: Replace x with –x; if equivalent, symmetric about y-axis.
Origin: Replace x with –x and y with –y; if equivalent, symmetric about the origin.
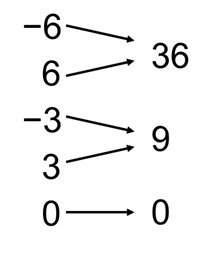
Even and Odd Functions
Even: for all x in the domain (symmetric about y-axis).
Odd: for all x in the domain (symmetric about the origin).
Transformations of Functions
Translations
Vertical: shifts up by b; shifts down by b.
Horizontal: shifts right by d; shifts left by d.
Reflections
Across x-axis:
Across y-axis:
Stretching and Shrinking
Vertical Stretch: ,
Vertical Shrink:
Horizontal Stretch/Shrink: , shrinks, stretches
Variation
Direct Variation
y varies directly as x if for some constant k.
Inverse Variation
y varies inversely as x if for some constant k.
Combined and Joint Variation
Joint Variation:
Combined Variation:
Additional info:
Some sections reference applications, modeling, and problem-solving strategies, which are essential for interpreting and applying algebraic concepts in real-world contexts.
