 Back
College Algebra Module 2 Exam Study Guide – Step-by-Step Guidance
Study Guide - Smart Notes
 Tailored notes based on your materials, expanded with key definitions, examples, and context.
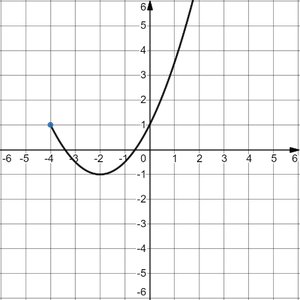
Q7. For the following graph of , find:
(a) Domain
(b) Range
(c) Interval(s) where increasing
(d)
(e) The value(s) of for which
Background
Topic: Graphs of Functions, Domain and Range, Function Evaluation, and Increasing/Decreasing Intervals
This question tests your ability to interpret a graph of a function and extract important information such as domain, range, intervals of increase, and specific function values.
Key Terms and Concepts:
Domain: The set of all possible -values for which the function is defined.
Range: The set of all possible -values (outputs) the function can take.
Increasing Interval: Where the function values rise as increases.
Function Evaluation: Finding means finding the -value when .
Solving : Find all -values where the graph crosses the horizontal line .
Step-by-Step Guidance
Domain: Look at the -axis and determine the leftmost and rightmost $x$-values where the graph exists. Pay attention to whether endpoints are included (solid dot) or excluded (open dot).
Range: Examine the -axis to find the lowest and highest $y$-values the graph attains. Again, check for inclusion/exclusion at endpoints.
Increasing Interval(s): Identify the interval(s) of where the graph rises as you move from left to right. Mark the $x$-values where this occurs.
Function Value at : Find the point on the graph where and read the corresponding -value.
Solving : Draw or imagine a horizontal line at and find all -values where the graph intersects this line.
Try solving on your own before revealing the answer!
Final Answers:
(a) Domain:
(b) Range:
(c) Increasing Interval(s):
(d) : $1$
(e) when
These answers are based on reading the graph: the domain starts at (solid dot) and continues right, the lowest -value is , the function increases after , is the $y$-value at , and at $x = -2$.
