 Back
BackCollege Algebra: Polynomial and Rational Functions, Optimization, and Systems of Equations
Study Guide - Smart Notes
 Tailored notes based on your materials, expanded with key definitions, examples, and context.
Polynomial Functions
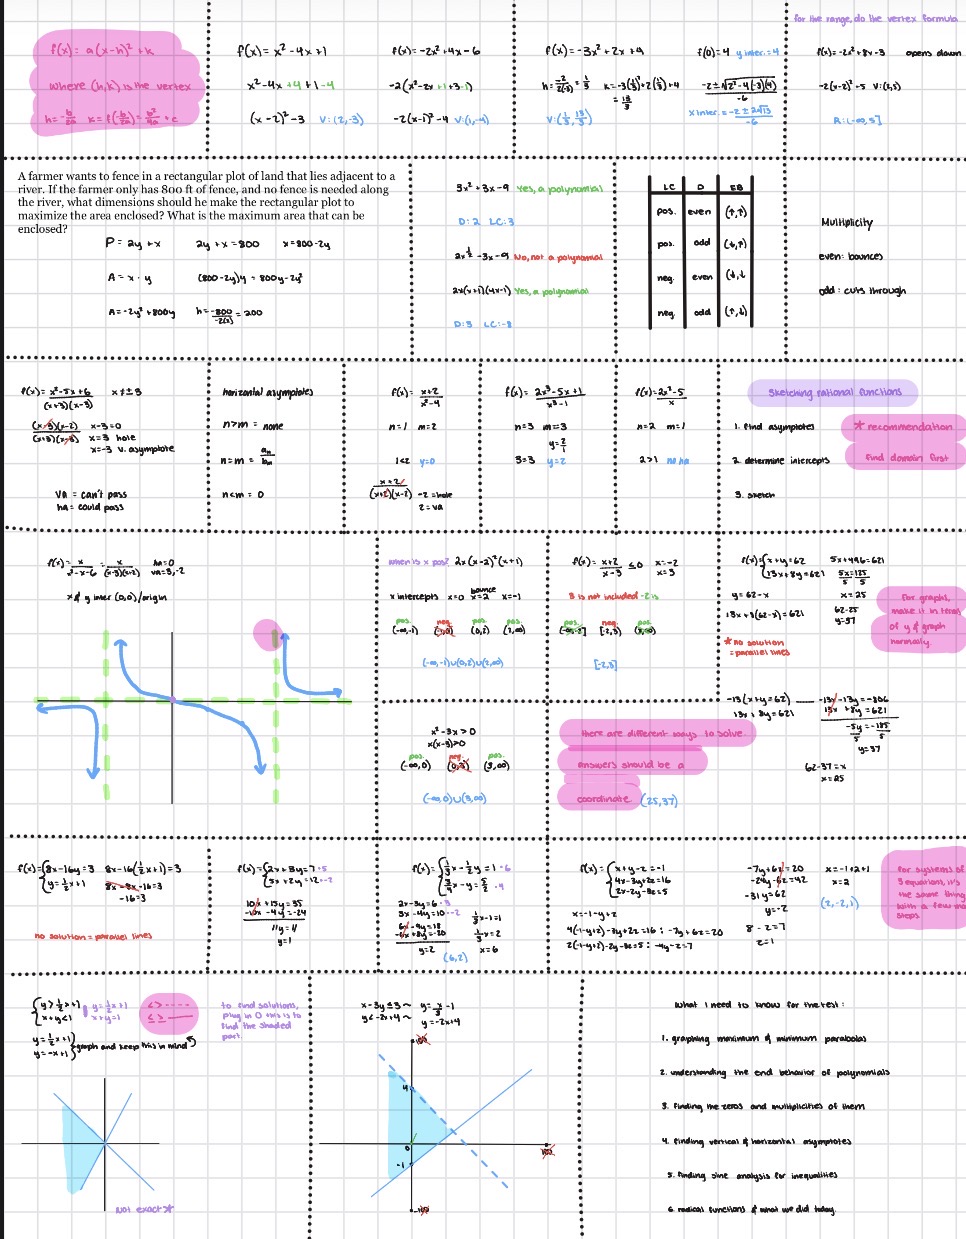
Vertex Form and Maximum/Minimum Values
Polynomial functions, especially quadratics, can be written in vertex form to easily identify their maximum or minimum values. The vertex form is useful for graphing and solving optimization problems.
Vertex Form: , where is the vertex.
Finding the Vertex: For , the vertex is at .
Maximum/Minimum: If , the parabola opens downward (maximum); if , it opens upward (minimum).
Example: For , vertex at .
Optimization Problem Example
Optimization problems often involve maximizing or minimizing an area or volume given certain constraints. A classic example is maximizing the area of a rectangle adjacent to a river with a fixed amount of fencing.
Problem: Maximize area of a rectangle with one side along a river, using 800 ft of fencing for the other three sides.
Let: = width (perpendicular to river), = length (parallel to river).
Constraint:
Area:
Substitute:
Find Maximum: Vertex at
Dimensions: ft, ft
Maximum Area: ft
Polynomial and Rational Functions
Identifying Polynomials
Polynomials are algebraic expressions consisting of variables and coefficients, involving only non-negative integer exponents.
Examples: (polynomial), (not a polynomial)
Degree: Highest exponent of the variable
End Behavior and Leading Coefficient Test
The end behavior of a polynomial function describes how the function behaves as or .
Even Degree, Positive Leading Coefficient: Both ends up
Even Degree, Negative Leading Coefficient: Both ends down
Odd Degree, Positive Leading Coefficient: Left down, right up
Odd Degree, Negative Leading Coefficient: Left up, right down
Multiplicity of Zeros
The multiplicity of a zero determines how the graph behaves at the x-intercept.
Multiplicity | Even | Odd |
|---|---|---|
Graph Behavior | Bounces | Crosses through |
Rational Functions
Asymptotes
Rational functions can have vertical, horizontal, or oblique (slant) asymptotes.
Vertical Asymptotes: Set denominator equal to zero and solve for .
Horizontal Asymptotes: Compare degrees of numerator and denominator.
Oblique Asymptotes: Occur when degree of numerator is one more than denominator.
Sketching Rational Functions
Find asymptotes
Determine intercepts
Find domain
Sketch the graph
Systems of Equations and Inequalities
Solving Systems of Equations
Systems of equations can be solved graphically or algebraically (substitution, elimination).
Graphical Solution: Intersection point(s) of the graphs represent solutions.
No Solution: Parallel lines
Infinite Solutions: Coincident lines
Solving Systems of Inequalities
Systems of inequalities are solved by graphing the solution regions for each inequality and finding the overlap.
Shaded Region: Represents all solutions that satisfy all inequalities in the system.
Boundary Lines: Solid for or , dashed for or .
Summary of Key Concepts
Graphing maximum and minimum parabolas
Understanding end behavior and zeros of polynomials
Finding zeros and multiplicities of polynomials
Finding vertical and horizontal asymptotes
Solving systems of equations and inequalities
