 Back
BackCollege Algebra Practice Final Exam Step-by-Step Guidance
Study Guide - Smart Notes
 Tailored notes based on your materials, expanded with key definitions, examples, and context.
Q1. The augmented matrix is in row-echelon form. Use back substitution to solve the associated system of linear equations for x, y, and z.
Background
Topic: Systems of Linear Equations & Matrices
This question tests your ability to interpret an augmented matrix in row-echelon form and use back substitution to solve for the variables in a system of equations.
Key Terms and Formulas:
Row-echelon form: A matrix form where each row has more leading zeros than the previous row.
Back substitution: Solving for variables starting from the last row upwards.
Step-by-Step Guidance
Write the system of equations corresponding to each row of the matrix.
Start with the last row, which should have only one variable (z). Solve for z.
Substitute the value of z into the second row to solve for y.
Substitute the values of y and z into the first row to solve for x.
Check your work by plugging the values back into the original equations.
Try solving on your own before revealing the answer!
Final Answer: (3, -3, -4)
By back substitution, you find z = -4, y = -3, and x = 3. The solution set is (3, -3, -4).
Q2. Use the method of elimination to solve the system of linear equations: 6x - 5y = 42, 5x + 30y = -170.
Background
Topic: Solving Systems of Linear Equations
This question tests your ability to use the elimination method to solve a system of two linear equations.
Key Terms and Formulas:
Elimination method: Combine equations to eliminate one variable, making it easier to solve for the other.
Step-by-Step Guidance
Align the equations so you can eliminate one variable by addition or subtraction.
Multiply one or both equations by a constant if needed to match coefficients.
Add or subtract the equations to eliminate one variable.
Solve for the remaining variable.
Substitute back to find the other variable.
Try solving on your own before revealing the answer!
Final Answer: (3, -6)
Solving by elimination gives x = 3 and y = -6.
Q3. Graph the solution set of the system of inequalities: x + y < 6, x - y > 6.
Background
Topic: Systems of Inequalities
This question tests your ability to graph the solution region for a system of linear inequalities.
Key Terms and Formulas:
Linear inequality: An inequality involving a linear function.
Solution region: The area on the graph where all inequalities are satisfied.
Step-by-Step Guidance
Rewrite each inequality in slope-intercept form if needed.
Graph each boundary line (dashed for < or >).
Determine which side of each line satisfies the inequality.
Shade the region where both inequalities overlap.
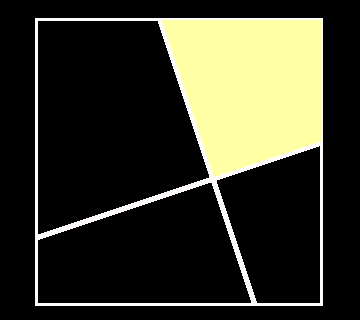
Try solving on your own before revealing the answer!
Final Answer: The solution region is the yellow area shown in the graph.
The region where both inequalities are satisfied is highlighted in yellow.
Q4. Graph the solution set of the following system of inequalities: x + y ≤ 2, y ≥ x² - 3.
Background
Topic: Systems of Linear and Nonlinear Inequalities
This question tests your ability to graph the solution region for a system involving a linear and a quadratic inequality.
Key Terms and Formulas:
Quadratic inequality: An inequality involving a quadratic function.
Solution region: The area on the graph where all inequalities are satisfied.
Step-by-Step Guidance
Graph the boundary line for x + y = 2 (solid for ≤).
Graph the parabola y = x² - 3 (solid for ≥).
Determine which side of each boundary satisfies the inequality.
Shade the region where both inequalities overlap.
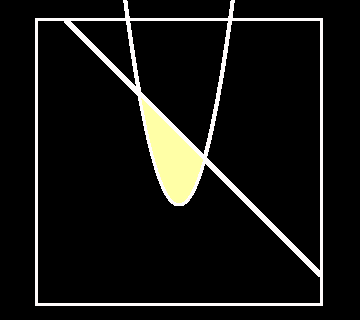
Try solving on your own before revealing the answer!
Final Answer: The solution region is the yellow area shown in the graph.
The region where both inequalities are satisfied is highlighted in yellow.
