 Back
BackCollege Algebra Study Guidance: Graphs, Functions, and Equations
Study Guide - Smart Notes
 Tailored notes based on your materials, expanded with key definitions, examples, and context.
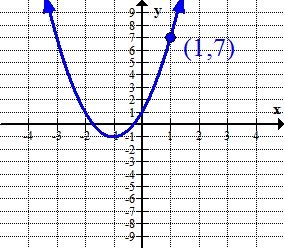
Q2. Use the graph below to write the equation of the graph in form.
Background
Topic: Quadratic Functions and Vertex Form
This question tests your ability to interpret a graph of a quadratic function and write its equation in vertex form, which is useful for identifying the vertex and direction of the parabola.
Key Terms and Formulas:
Vertex form of a quadratic:
Vertex: is the turning point of the parabola.
"a" determines the direction and width of the parabola (if , opens upward; if , opens downward).
Step-by-Step Guidance
Identify the vertex of the parabola from the graph. The vertex is the lowest point, which appears to be at .
Write the general vertex form using the identified vertex: .
Use another point on the graph to solve for . The graph shows the point lies on the parabola.
Substitute into the equation: .
Try solving on your own before revealing the answer!
Final Answer:
By substituting the point and solving for , you find . The equation matches the graph's vertex and passes through the given point.
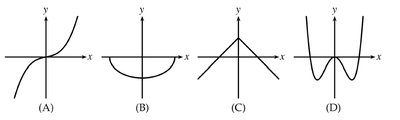
Q4. Determine which graph(s) is/are one-to-one function?
Background
Topic: One-to-One Functions
This question tests your understanding of the definition of a one-to-one function, which is a function where each value corresponds to exactly one value.
Key Terms:
One-to-one function: Passes the horizontal line test (no horizontal line intersects the graph more than once).
Vertical line test: Used to check if a graph is a function (no vertical line intersects more than once).
Step-by-Step Guidance
Examine each graph and apply the horizontal line test. If any horizontal line crosses the graph more than once, it is not one-to-one.
Graph A: Check if any horizontal line crosses more than once. Graph B, C, D: Repeat the process for each.
Identify which graph(s) pass the horizontal line test and thus are one-to-one.
Try solving on your own before revealing the answer!
Final Answer: A only
Graph A passes the horizontal line test, so it is the only one-to-one function among the options.
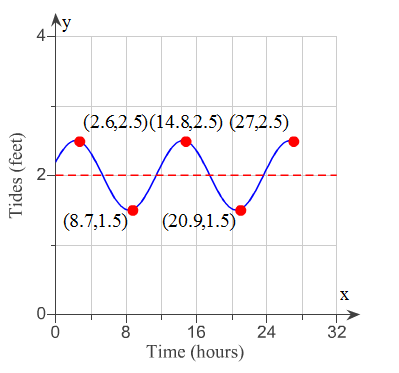
Q6. The graph gives the tide at a certain beach hours after midnight on a particular day, . When was the water level increasing?
Background
Topic: Intervals of Increase and Decrease
This question tests your ability to interpret a periodic graph and identify intervals where the function is increasing.
Key Terms:
Increasing interval: Where the graph moves upward as increases.
Decreasing interval: Where the graph moves downward as increases.
Step-by-Step Guidance
Identify the points where the graph changes from decreasing to increasing (local minima).
Mark the intervals between these points where the graph is rising.
List the intervals in where the tide is increasing, based on the graph's shape and labeled points.
Try solving on your own before revealing the answer!
Final Answer:
The tide is increasing during these intervals, as shown by the upward slope of the graph.
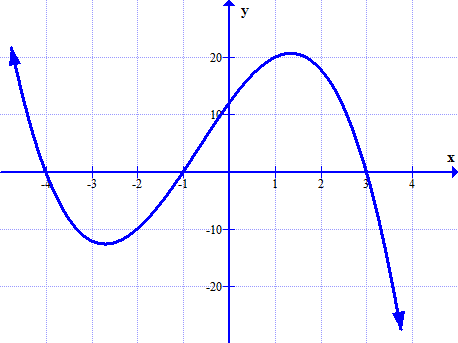
Q14. Write the completed factored form of the polynomial in the graph below. The leading coefficient is either 1 or -1 and integer zeros.
Background
Topic: Factoring Polynomials from Graphs
This question tests your ability to read a polynomial graph, identify its zeros, and write its factored form.
Key Terms and Formulas:
Zero/root: Where the graph crosses the -axis.
Factored form: , where are the zeros.
Leading coefficient: Determines the direction of the graph (up or down).
Step-by-Step Guidance
Identify the -intercepts (zeros) from the graph. These are the values where the graph crosses the $x$-axis.
Write the polynomial in factored form using these zeros: .
Determine the sign of the leading coefficient by observing the end behavior of the graph.
Check if the graph opens up or down to decide if is positive or negative.
Try solving on your own before revealing the answer!
Final Answer:
The zeros are at and the graph opens downward, so the leading coefficient is .
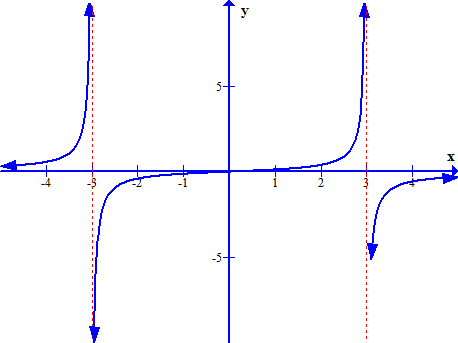
Q15. Given the graph of the following rational function, select the statement that is true.
Background
Topic: Rational Functions and Asymptotes
This question tests your ability to interpret the graph of a rational function and identify its vertical and horizontal asymptotes.
Key Terms:
Vertical asymptote: A line where the function approaches infinity.
Horizontal asymptote: A line where the function approaches as goes to infinity.
Domain: All possible values for the function.
Step-by-Step Guidance
Identify the vertical asymptotes by finding where the graph goes to infinity (dashed lines).
Check the horizontal asymptote by observing the behavior as goes to positive or negative infinity.
Compare the graph to the statements provided and determine which is true based on the visual information.
Try solving on your own before revealing the answer!
Final Answer: The rational function contains a vertical asymptote at .
The graph shows vertical asymptotes at and , but the correct answer matches the statement about $x = -3$.
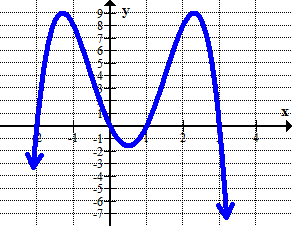
Q16. Below is the graph of a polynomial function. Which statement is true?
Background
Topic: Polynomial Graphs and Properties
This question tests your ability to interpret the graph of a polynomial and deduce properties such as degree, zeros, turning points, and leading coefficient.
Key Terms:
Degree: The highest power of in the polynomial.
Turning point: Where the graph changes direction.
Leading coefficient: Determines the end behavior of the graph.
Step-by-Step Guidance
Count the number of turning points in the graph. Each turning point suggests a minimum degree.
Observe the end behavior to determine the sign of the leading coefficient.
Check for zeros at specific values, such as .
Compare these observations to the statements provided and decide which are true.
Try solving on your own before revealing the answer!
Final Answer: The minimum degree of the polynomial is 4.
The graph has three turning points, so the minimum degree is 4. The other statements may not all be true.
