Back
College Algebra Study Guide: Coordinates, Functions, Graphs, and Operations
Study Guide - Smart Notes
 Tailored notes based on your materials, expanded with key definitions, examples, and context.
Rectangular Coordinates and Graphs
Distance and Midpoint Formulas
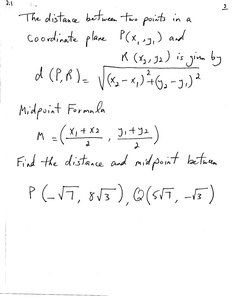
The rectangular coordinate system is fundamental for graphing equations and analyzing geometric relationships. The distance formula calculates the distance between two points P(x_1, y_1) and Q(x_2, y_2) in the plane:
Distance Formula:
Midpoint Formula:
Example: Find the distance and midpoint between and .
Right Triangles and Collinearity
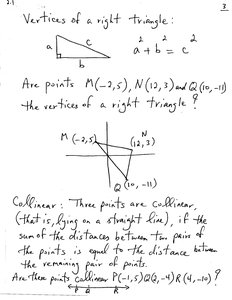
To determine if three points form a right triangle, use the Pythagorean Theorem. Points are collinear if the sum of the distances between two pairs equals the distance between the remaining pair.
Right Triangle: for sides , , and hypotenuse .
Collinearity: Three points are collinear if they lie on a straight line.
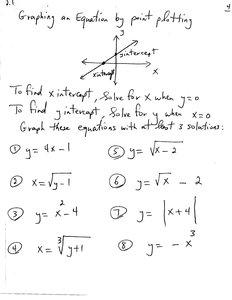
Graphing by Point Plotting
Graphing equations by plotting points involves finding x- and y-intercepts and plotting solutions.
X-intercept: Solve for when .
Y-intercept: Solve for when .
Example Equations: , , , , etc.
Circles
Equation of a Circle
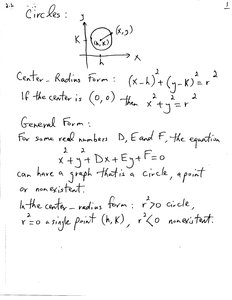
The equation of a circle in the coordinate plane can be written in center-radius form or general form.
Center-Radius Form: where is the center and is the radius.
General Form:
Special Cases:
: Circle
: Single point
: Nonexistent
Identifying Circles from Equations
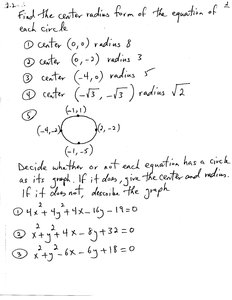
Given equations, determine if they represent circles and find their centers and radii.
Example:
Convert to center-radius form to identify circle properties.
Functions
Definition and Properties
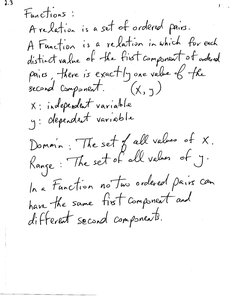
A function is a relation in which each input (first component) has exactly one output (second component). The domain is the set of all possible input values, and the range is the set of all possible output values.
Ordered Pair:
Independent Variable:
Dependent Variable:
No two ordered pairs in a function can have the same first component with different second components.
Domain and Range from Relations and Graphs
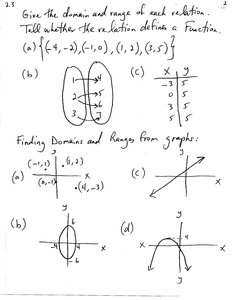
Determine the domain and range for given relations and graphs, and decide if the relation is a function.
Example: Relation
Use mapping diagrams and tables to analyze functions.
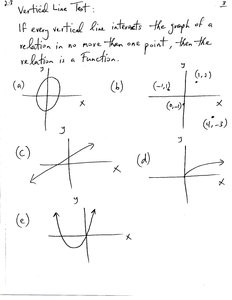
Vertical Line Test
The vertical line test determines if a graph represents a function: if any vertical line intersects the graph at more than one point, it is not a function.
Function Classification and Domain/Range
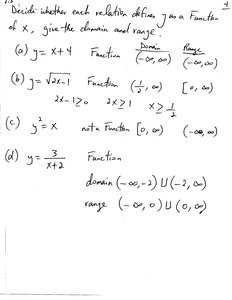
Decide whether a relation defines a function and give its domain and range.
Example: (Function, domain , range $(-\infty, \infty)$)
For , not a function.
Function Evaluation
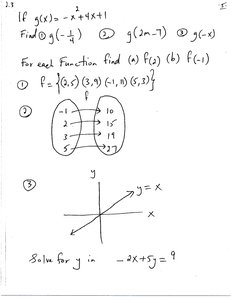
Evaluate functions for given values and analyze mappings.
Example: , find , ,
Linear Functions
Definition and Standard Form
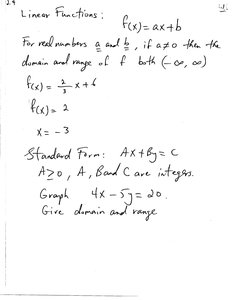
A linear function is of the form . The standard form of a linear equation is , where , , and are integers and .
Domain and Range: If , domain and range are .
Example: , ,
Slope of a Line
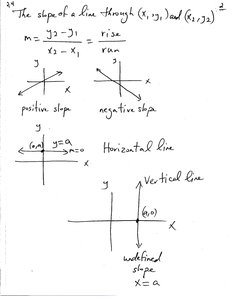
The slope of a line through and is given by:
Positive Slope: Line rises left to right
Negative Slope: Line falls left to right
Horizontal Line: ,
Vertical Line: , slope undefined
Finding and Graphing Slopes
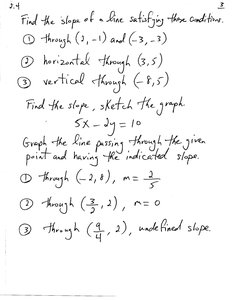
Find the slope for given conditions and graph lines with specified slopes.
Example: Through and , horizontal through , vertical through
Graph lines passing through points with indicated slopes.
Equations of Lines and Linear Models
Forms of Linear Equations
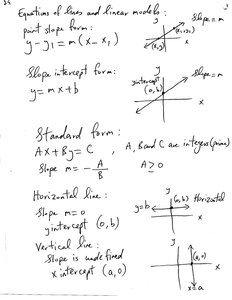
Linear equations can be written in several forms:
Point-Slope Form:
Slope-Intercept Form:
Standard Form:
Horizontal Line: ,
Vertical Line: , slope undefined
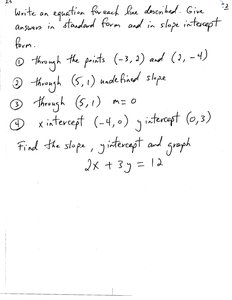
Writing Equations for Lines
Write equations for lines given points, slopes, and intercepts in both standard and slope-intercept forms.
Example: Through and , through with undefined slope, through $(5, 1)$ with , x-intercept , y-intercept
Parallel and Perpendicular Lines
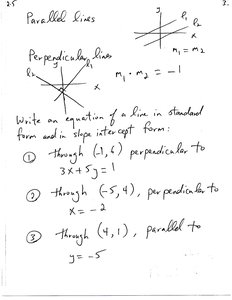
Parallel lines have equal slopes; perpendicular lines have slopes that are negative reciprocals.
Parallel:
Perpendicular:
Write equations for lines parallel or perpendicular to given lines.
Graphs of Basic Functions
Continuity
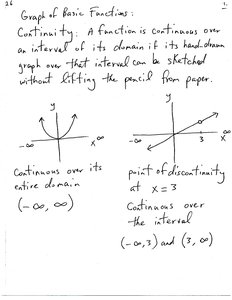
A function is continuous on an interval if its graph can be drawn without lifting the pencil. Discontinuity occurs at points where the graph is broken.
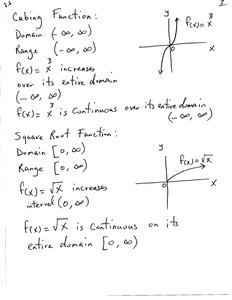
Continuous over entire domain:
Point of discontinuity: At , continuous over and
Basic Function Types
Common functions include identity, squaring, cubing, square root, cube root, absolute value, and greatest integer functions.
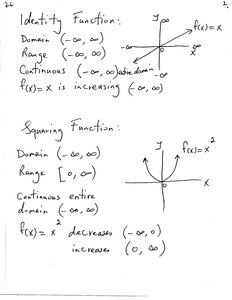
Identity Function: , domain and range
Squaring Function: , domain , range
Cubing Function: , domain and range
Square Root Function: , domain and range
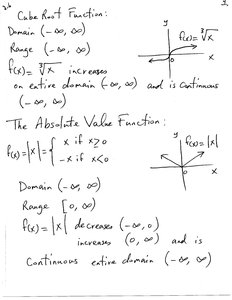
Cube Root Function: , domain and range
Absolute Value Function: , domain , range
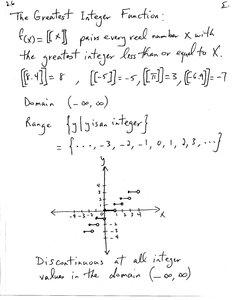
Greatest Integer Function: , domain , range is all integers
Piecewise Functions
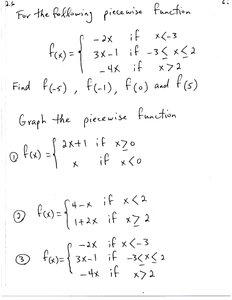
Piecewise functions are defined by different expressions over different intervals.
Example:
Evaluate and graph piecewise functions.
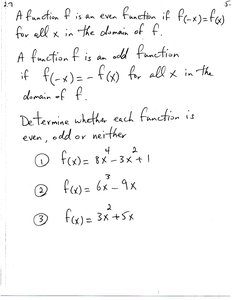
Even and Odd Functions
A function is even if for all in its domain, and odd if for all .
Example: (even), (odd), (neither)
Graphing Techniques
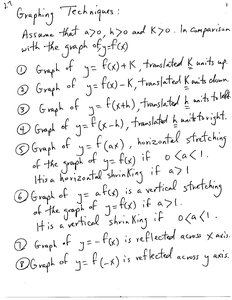
Transformations
Graph transformations include translations, stretches, shrinks, and reflections.
Vertical Translation: (up), (down)
Horizontal Translation: (left), (right)
Horizontal Stretch/Shrink: ( shrink, stretch)
Vertical Stretch/Shrink: ( stretch, shrink)
Reflection: (x-axis), (y-axis)
Graphing Functions with Transformations
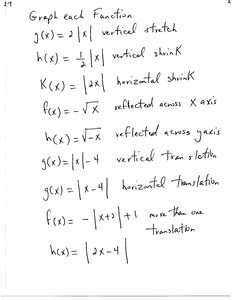
Apply transformations to graph functions such as , , , , , , , .
Symmetry
Types of Symmetry
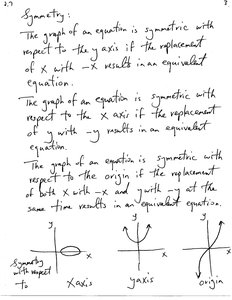
Graphs may exhibit symmetry with respect to the x-axis, y-axis, or origin.
Y-axis Symmetry: Replace with
X-axis Symmetry: Replace with
Origin Symmetry: Replace both and with and
Function Operations and Composition
Operations on Functions
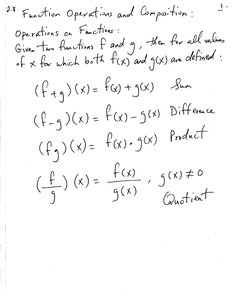
Functions can be added, subtracted, multiplied, and divided.
Sum:
Difference:
Product:
Quotient: ,
Domains of Function Operations
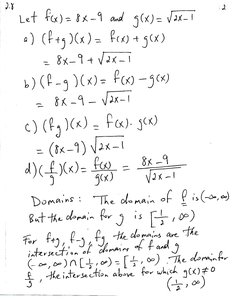
The domain of a function operation is the intersection of the domains of the individual functions, with additional restrictions for division.
Example: ,
Domain for :
Domain for : Intersection of domains,
Difference Quotient
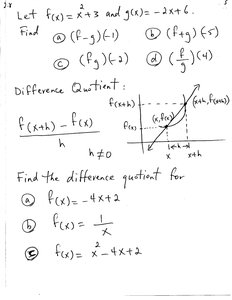
The difference quotient is used to analyze rates of change:
,
Find the difference quotient for various functions.
Composition of Functions
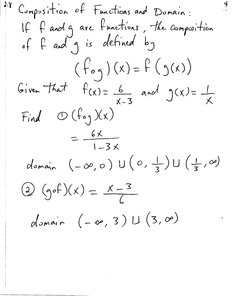
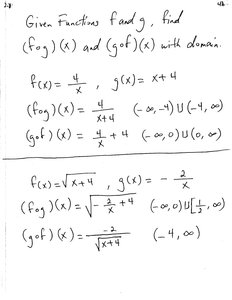
The composition of functions and is defined as . The domain is determined by the domains of $f$ and $g$.
Example: ,
Find and with domains.