 Back
College Algebra Study Guide: Functions and Graphs (Sections 2.1–2.7)
Study Guide - Smart Notes
 Tailored notes based on your materials, expanded with key definitions, examples, and context.
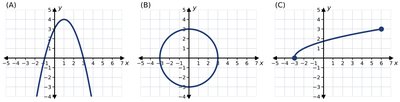
Q4. Use the vertical line test to decide which graphs represent y as a function of x. Give the domain and range of each graph in interval notation (including graph B).
Background
Topic: Functions and Relations, Domain and Range
This question tests your understanding of how to determine whether a graph represents a function using the vertical line test, and how to find the domain and range of a relation from its graph.
Key Terms and Formulas:
Function: A relation in which each input (x-value) corresponds to exactly one output (y-value).
Vertical Line Test: If any vertical line crosses the graph more than once, the graph does not represent a function.
Domain: The set of all possible input values (x-values).
Range: The set of all possible output values (y-values).
Interval Notation: A way to write domains and ranges using intervals, e.g., .
Step-by-Step Guidance
Examine each graph (A, B, and C) and apply the vertical line test. Ask yourself: Does any vertical line intersect the graph at more than one point?
For each graph, decide if it represents y as a function of x based on your test.
For each graph, identify the domain by looking at the x-values covered by the graph. Express your answer in interval notation.
For each graph, identify the range by looking at the y-values covered by the graph. Express your answer in interval notation.
Be careful to note whether endpoints are included (closed or open circles) and whether the graph extends infinitely or is bounded.
Try solving on your own before revealing the answer!
Final Answer:
Graph A: Passes the vertical line test, so it is a function. Domain: . Range: .
Graph B: Fails the vertical line test (vertical lines intersect the circle twice), so it is not a function. Domain: . Range: $[-3, 3]$.
Graph C: Passes the vertical line test, so it is a function. Domain: . Range: (including endpoints).
The vertical line test helps us quickly determine if a graph represents a function. Domains and ranges are found by examining the extent of the graph along the x- and y-axes, respectively.
