 Back
BackCollege Algebra Study Guide: Functions and Their Graphs
Study Guide - Smart Notes
 Tailored notes based on your materials, expanded with key definitions, examples, and context.
Relations and Functions
Definition of Relations
A relation is a correspondence between two sets, typically called the domain (input values) and the range (output values). Each element from the domain is paired with at least one element from the range. Relations can be described verbally, numerically, graphically, or algebraically.
Domain: The set of all possible input values (x).
Range: The set of all possible output values (y).
Ordered pairs: Each relation can be represented as a set of ordered pairs (x, y).
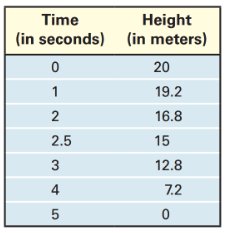
Example: An astronaut measures the height of a rock at various times after throwing it upward. The domain is the set of times, and the range is the set of measured heights.
Time (in seconds) | Height (in meters) |
|---|---|
0 | 20 |
1 | 19.2 |
2 | 16.8 |
2.5 | 15 |
3 | 12.8 |
4 | 7.2 |
5 | 0 |
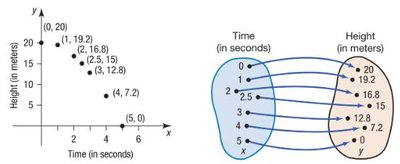
The relation can also be represented graphically or as a mapping diagram:
Definition of Functions
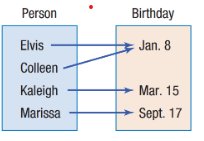
A function is a special type of relation in which each element of the domain corresponds to exactly one element of the range. All functions are relations, but not all relations are functions.
To determine if a relation is a function, check that each input (x) has only one output (y).
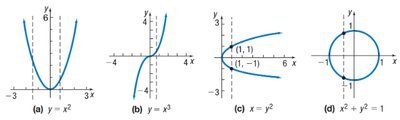
Graphically, a function passes the vertical line test: every vertical line intersects the graph at most once.
Example: The following graphs illustrate functions and non-functions:
Function Notation and Evaluation
Function Notation
Functions are typically labeled with letters such as f or g. The notation f(x) represents the value of the function f at input x. We write y = f(x) to indicate that y depends on x.
Evaluating a function: To evaluate f(x), substitute the value of x into the function's equation.
Example: If f(x) = x2 - 2x + 1, then f(2) = 22 - 2*2 + 1 = 1.
Domain of Functions
Finding the Domain
The domain of a function is the set of all input values (x) for which the function is defined. To find the domain, identify values of x that are not allowed (such as those causing division by zero or negative values under a square root).
Polynomial functions: Domain is all real numbers, .
Rational functions: Domain excludes values that make the denominator zero.
Radical functions: Domain includes values where the radicand is non-negative.
Example: For , the domain is all real numbers except .
Function Equations and Intercepts
Intercepts
The x-intercept (or zero) of a function is the value of x for which . The y-intercept is the value of y for which .
To find intercepts, substitute 0 for x or y in the function's equation and solve.
The Graph of a Function
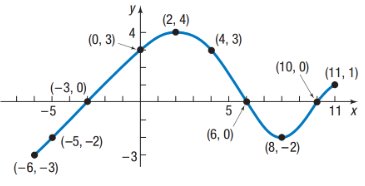
Information from Graphs
The graph of a function consists of all ordered pairs (x, y) plotted on a coordinate plane. From the graph, you can determine:
Domain and range
Intercepts
Where the function is positive or negative: Above or below the x-axis
Where the function is increasing, decreasing, or constant: As x increases, observe the behavior of y
Local and absolute maxima and minima: Highest and lowest points in an interval or the entire domain
Graphing Functions
Library of Parent Functions
A parent function is the simplest form of a function in a family. Common parent functions include:
Linear:
Quadratic:
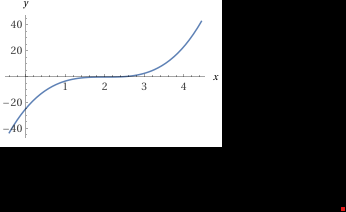
Cubic:
Square Root:
Cube Root:
Reciprocal:
Absolute Value:
Graphing Functions Using Transformations
Transformations allow you to graph functions by shifting, stretching, compressing, or reflecting parent functions.
Vertical shifts: shifts up; shifts down.
Horizontal shifts: shifts left; shifts right.
Vertical stretch/compression: stretches if , compresses if .
Horizontal stretch/compression: compresses if , stretches if .
Reflection: reflects over the x-axis; reflects over the y-axis.
Example: The function is a vertical shift of the parent quadratic function .
Summary Table: Graphing Transformations
Transformation | Equation | Effect |
|---|---|---|
Vertical Shift | Shift up k units | |
Vertical Shift | Shift down k units | |
Horizontal Shift | Shift left h units | |
Horizontal Shift | Shift right h units | |
Vertical Stretch | Stretch if , compress if | |
Horizontal Stretch | Compress if , stretch if | |
Reflection (x-axis) | Reflect over x-axis | |
Reflection (y-axis) | Reflect over y-axis |
Additional info: These notes cover foundational concepts in college algebra, including relations, functions, function notation, domain and range, graphing, and transformations. All examples and images are directly relevant to the course topics.
