 Back
BackCollege Algebra Study Guide: Functions, Domains, Graphs, and Transformations
Study Guide - Smart Notes
 Tailored notes based on your materials, expanded with key definitions, examples, and context.
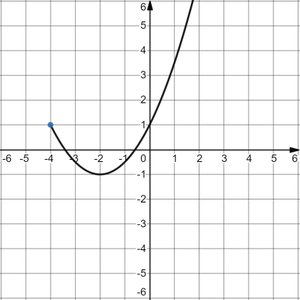
Q7. For the following graph of f(x), find:
(a) Domain
(b) Range
(c) Interval(s) where increasing
(d) f(0)
(e) The value(s) of x for which f(x) = -1
Background
Topic: Function Analysis and Graph Interpretation
This question tests your ability to interpret a graph of a function and extract important information such as domain, range, intervals of increase/decrease, and specific function values.
Key Terms:
Domain: The set of all possible input values (x-values) for which the function is defined.
Range: The set of all possible output values (y-values) the function can take.
Increasing Interval: Where the function's output increases as x increases.
f(0): The value of the function when x = 0.
f(x) = -1: The x-value(s) where the function's output is -1.
Step-by-Step Guidance
Examine the graph to determine the domain. Look for the leftmost and rightmost x-values where the function exists. Pay attention to any endpoints or open circles.
Identify the range by observing the lowest and highest y-values the function attains. Check for any gaps or endpoints.
Find the interval(s) where the function is increasing. Trace the graph from left to right and note where the y-values are rising as x increases.
To find f(0), locate x = 0 on the graph and read the corresponding y-value.
For f(x) = -1, look for the point(s) on the graph where the y-value is -1 and record the corresponding x-value(s).
Try solving on your own before revealing the answer!
Final Answer:
(a) Domain:
(b) Range:
(c) Increasing on
(d)
(e) when
The domain and range are determined by the endpoints and the behavior of the graph. The increasing interval is where the graph rises as you move right. Specific values are read directly from the graph.
