 Back
College Algebra Study Guide: Types of Functions and Their Rates of Change
Study Guide - Smart Notes
 Tailored notes based on your materials, expanded with key definitions, examples, and context.
Q1. Why is it reasonable for the graph to pass through the origin?
Background
Topic: Linear Functions and Real-World Interpretation
This question tests your understanding of how linear functions can model real-world situations, specifically why the graph starts at the origin (0,0).
Key Terms:
Origin: The point (0,0) on a graph.
Linear Function: A function whose graph is a straight line.
Step-by-Step Guidance
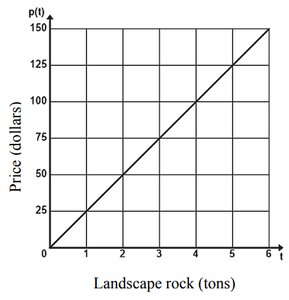
Consider what the axes represent: the horizontal axis is tons of landscape rock (), and the vertical axis is price ().
Think about what it means to have zero tons of rock. What should the price be?
Reflect on whether it makes sense for the price to be zero when no rock is purchased.
Try solving on your own before revealing the answer!
Final Answer:
It is reasonable for the graph to pass through the origin because if no landscape rock is purchased (), the price should be $0$. This reflects the real-world situation where you pay nothing if you buy nothing.
Q2. Find the slope of the graph, then interpret the slope as a rate of change.
Background
Topic: Slope and Rate of Change in Linear Functions
This question is about calculating the slope of a linear function and understanding what it means in context.
Key Terms and Formulas:
Slope (): Measures the rate of change between two variables.
Formula for slope:
Rate of Change: How much one quantity changes with respect to another.
Step-by-Step Guidance
Identify two points on the graph. For example, (0, 0) and (6, 150).
Use the slope formula: , where is price and is tons.
Set up the calculation using the coordinates you chose.
Interpret what the slope means in this context: How much does the price increase for each additional ton?
Try solving on your own before revealing the answer!
Final Answer:
The slope is . This means the price increases by $25 for each additional ton of landscape rock purchased.
Q3. What type of function is this? How do you know?
Background
Topic: Identifying Function Types
This question asks you to classify the function based on its graph and properties.
Key Terms:
Linear Function: A function whose graph is a straight line.
Nonlinear Function: A function whose graph is not a straight line.
Step-by-Step Guidance
Examine the graph: Is it a straight line or does it curve?
Recall the definition of a linear function.
Consider the equation form: Does it fit ?
Try solving on your own before revealing the answer!
Final Answer:
This is a linear function because its graph is a straight line and it can be written in the form .
Q4. Write a function in slope-intercept form to correspond with the graph.
Background
Topic: Writing Linear Equations
This question tests your ability to write the equation of a line given its slope and y-intercept.
Key Formula:
Slope-intercept form:
is the slope, is the y-intercept.
Step-by-Step Guidance
Recall the slope you found in the previous question.
Determine the y-intercept from the graph (where the line crosses the vertical axis).
Write the function in the form .
Try solving on your own before revealing the answer!
Final Answer:
The function is . The slope is 25 and the y-intercept is 0, so the equation matches the graph.
Q5. Suppose there is a 30-ton limit to the amount of landscape rock that can be purchased. Write the relevant domain and range in interval notation.
Background
Topic: Domain and Range of Functions
This question tests your ability to determine the domain and range for a function based on real-world constraints.
Key Terms:
Domain: The set of possible input values (tons of rock).
Range: The set of possible output values (price).
Interval Notation: A way to write the set of values between two endpoints.
Step-by-Step Guidance
Identify the minimum and maximum values for (tons of rock).
Calculate the corresponding minimum and maximum values for (price).
Write the domain and range using interval notation.
Try solving on your own before revealing the answer!
Final Answer:
Domain: (tons of rock) Range: (dollars), since .
Q6. Create a table of points and graph
Background
Topic: Graphing Linear Functions
This question tests your ability to create a table of values and plot a linear function.
Key Formula:
Step-by-Step Guidance
Choose several values for (e.g., ).
Calculate for each value using the formula.
Fill in the table with your values and corresponding values.
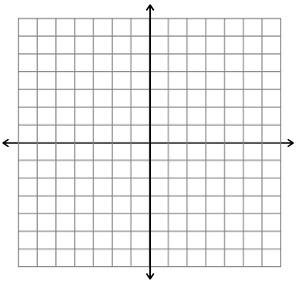
Plot the points on a graph and draw the line.
Try solving on your own before revealing the answer!
Final Answer:
Sample table: | -2 | 0 0 | 3 2 | 6 4 | 9 The graph is a straight line passing through these points.
Q7. The height in feet of a firework shell can be modeled by the equation where is the time in seconds since ignition.
Background
Topic: Quadratic Functions and Modeling
This question involves using a quadratic function to model a real-world scenario.
Key Formula:
Step-by-Step Guidance
For each given time value (), substitute into the formula to calculate .
Fill in the table with your calculated heights.
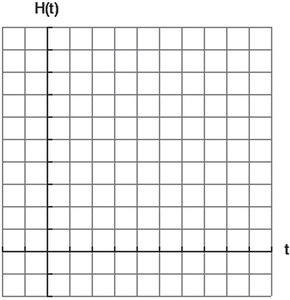
Plot the points on the provided graph grid.
Try solving on your own before revealing the answer!
Final Answer:
Sample table (rounded): | 0 | 0 2 | 480 4 | 896 8 | 1024 12 | 896 14 | 720 16 | 512 18 | 272 The graph is a parabola opening downward.
Q8. Give a relevant domain and range for using interval notation.
Background
Topic: Domain and Range for Quadratic Functions
This question tests your ability to determine domain and range for a quadratic function based on context.
Key Terms:
Domain: Possible values for (time).
Range: Possible values for (height).
Step-by-Step Guidance
Consider the physical meaning: starts at 0 and ends when the firework returns to the ground.
Find the maximum value of and the time interval where .
Write the domain and range in interval notation.
Try solving on your own before revealing the answer!
Final Answer:
Domain: (seconds) Range: (feet), since the maximum height is 1024 feet and the firework returns to the ground at .
Q9. Approximate the time interval over which the height of the firework is increasing, and the interval over which it is decreasing. Use interval notation.
Background
Topic: Increasing and Decreasing Intervals for Quadratic Functions
This question tests your ability to analyze where a function is increasing or decreasing based on its graph.
Key Terms:
Increasing Interval: Where gets larger as increases.
Decreasing Interval: Where gets smaller as increases.
Step-by-Step Guidance
Find the vertex of the parabola, which is the maximum point.
Determine the interval before the vertex (increasing) and after the vertex (decreasing).
Write the intervals in interval notation.
Try solving on your own before revealing the answer!
Final Answer:
Increasing interval: Decreasing interval: The height increases until seconds, then decreases until the firework returns to the ground.
Q10. Graph the function on Desmos and use the graph to approximate all values of for which . Sketch the solutions on the graph above.
Background
Topic: Solving Quadratic Equations Graphically
This question tests your ability to use a graph to find solutions to a quadratic equation.
Key Formula:
Set and solve
Step-by-Step Guidance
Rewrite the equation:
Use the quadratic formula to solve for .
Find the two values of where the height is 960 feet.
Try solving on your own before revealing the answer!
Final Answer:
The values of where are approximately seconds and seconds. These are the times when the firework reaches 960 feet on its way up and down.
