 Back
BackCollege Algebra Study Notes: Equations, Graphs, and Functions
Study Guide - Smart Notes
 Tailored notes based on your materials, expanded with key definitions, examples, and context.
Linear Equations
Definition and Properties
Linear equations are fundamental in algebra and represent equations of the first degree, meaning the highest power of the variable is one. - Definition: A linear equation in one variable is an equation that can be written in the form ax + b = 0, where a and b are constants and x is the variable. - Example: - Solving Linear Equations: Isolate the variable using inverse operations. 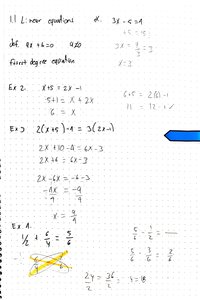
Solving Linear Equations: Examples
- Example 1: - Example 2:
Graphs
Distance and Midpoint Formulas
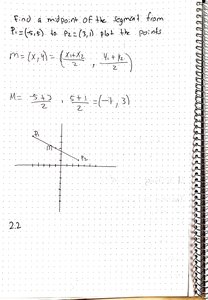
Graphs are visual representations of equations and relationships between variables. The distance and midpoint formulas are essential for analyzing points in the coordinate plane. - Distance Formula: Provides a method for computing the distance between two points and : - Example: Find the distance between and : - Midpoint Formula: The midpoint of the segment from to is: 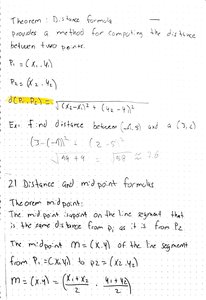
Intercepts of a Graph
Intercepts are points where a graph crosses the axes. - x-intercept: The x-coordinate where the graph crosses the x-axis. - y-intercept: The y-coordinate where the graph crosses the y-axis. - Example: For the graph shown, x-intercepts are and y-intercept is . 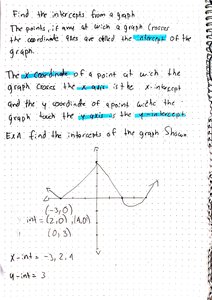
Finding Intercepts from Equations
- To find the x-intercept, set and solve for . - To find the y-intercept, set and solve for . - Example: x-intercepts: y-intercept: 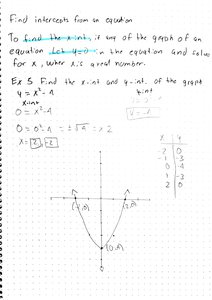
Symmetry in Graphs
Symmetry helps identify properties of graphs. - Symmetry with respect to x-axis: If for every , is also on the graph. - Symmetry with respect to y-axis: If for every , is also on the graph. - Symmetry with respect to origin: If for every , is also on the graph. 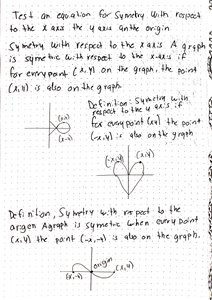
Testing for Symmetry
- Replace with for x-axis symmetry, with for y-axis symmetry, and both for origin symmetry. - Example: Test for symmetry. 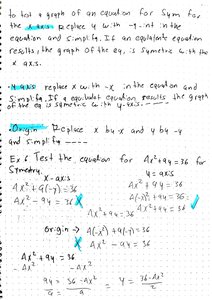
Slope of a Line
The slope measures the steepness of a line. - Positive slope: Line rises from left to right. - Negative slope: Line falls from left to right. - Zero slope: Line is horizontal. - Undefined slope: Line is vertical. - Formula: 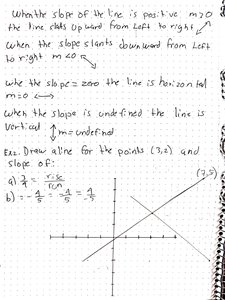
Equations of Lines
- Vertical line: - Horizontal line: - Point-slope form: 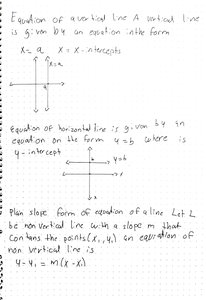
Slope-Intercept Form
- Equation: where is the slope and is the y-intercept. 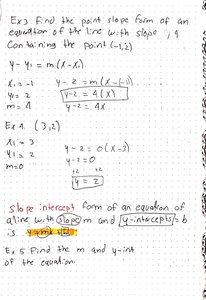
Functions and Their Graphs
Definition of Functions
Functions are a special type of relation where each input has exactly one output. - Domain: The set of all possible input values (x-values). - Range: The set of all possible output values (y-values). - Function: A relation from set X to set Y such that each element of X corresponds to exactly one element of Y. 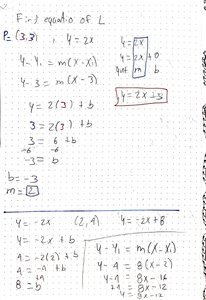
Identifying Functions
- If each input has only one output, the relation is a function. - Example: Menu items and prices: Each item has one price, so this is a function. 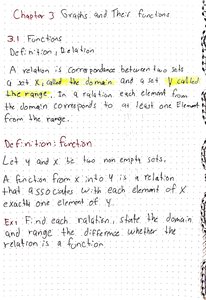
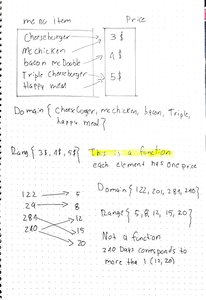
Domain and Range from Graphs
- Example: is a function. is not a function. 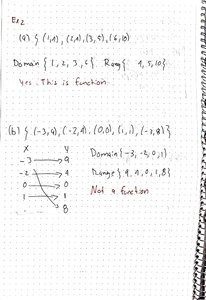
Function Notation
- Notation: represents the value of the function at . - Example: 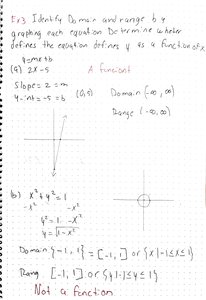
Difference Quotient
The difference quotient is used to measure the average rate of change of a function. - Definition: , - Example: For , 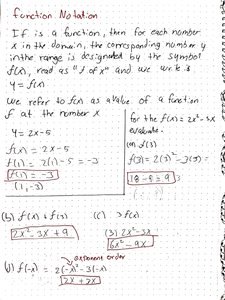
Finding Domain of Functions
- The domain is the set of real numbers for which the function is defined. - Exclude values that make denominators zero or radicands negative (for even roots). - Example: Domain: 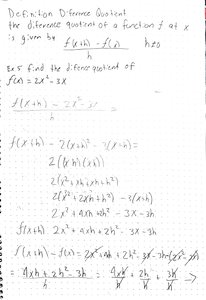
Operations on Functions
Functions can be added, subtracted, multiplied, or divided. - Example: , 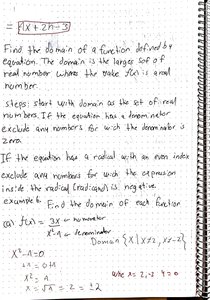
Graphs of Functions and Non-Functions
- Example: is a function; is not a function. 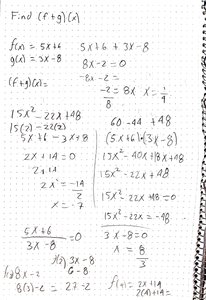
Properties of Functions: Even and Odd
- Even Function: for all in the domain. Graph is symmetric with respect to the y-axis. - Odd Function: for all in the domain. Graph is symmetric with respect to the origin. 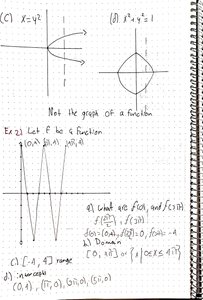
Increasing, Decreasing, and Constant Functions
- Increasing: Function rises as increases. - Decreasing: Function falls as increases. - Constant: Function remains unchanged as increases. 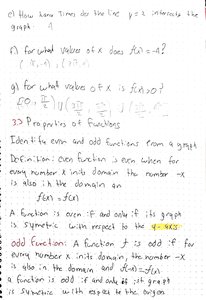
Local Maxima and Minima
- Local maximum: Occurs where the graph changes from increasing to decreasing. - Local minimum: Occurs where the graph changes from decreasing to increasing. 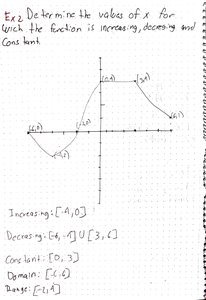
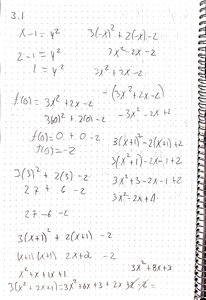
Evaluating Functions
- Substitute values into the function to find outputs. - Example: 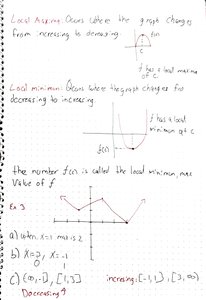
Summary Table: Types of Symmetry
Type of Symmetry | Test | Graph Property |
|---|---|---|
x-axis | Replace y with -y | Symmetric about x-axis |
y-axis | Replace x with -x | Symmetric about y-axis |
Origin | Replace x with -x and y with -y | Symmetric about origin |
Summary Table: Forms of Linear Equations
Form | Equation | Description |
|---|---|---|
Point-slope | Line with slope m through (x1, y1) | |
Slope-intercept | Line with slope m and y-intercept b | |
Vertical | Vertical line at x = a | |
Horizontal | Horizontal line at y = b |
