 Back
BackCollege Algebra Test 2 Review – Step-by-Step Guidance
Study Guide - Smart Notes
 Tailored notes based on your materials, expanded with key definitions, examples, and context.
Q13. Explain what the vertical line test is for and how to use it.
Background
Topic: Functions and Graphs
This question tests your understanding of how to determine if a graph represents a function using the vertical line test.
Key Terms:
Function: A relation in which each input (x-value) has exactly one output (y-value).
Vertical Line Test: A method to determine if a graph is a function.
Step-by-Step Guidance
Imagine drawing vertical lines (parallel to the y-axis) across the entire graph.
Observe how many times each vertical line intersects the graph.
If any vertical line crosses the graph more than once, the graph does not represent a function.
If every vertical line crosses the graph at most once, the graph does represent a function.
Try solving on your own before revealing the answer!
Q14. For each relation, state if it is a function. State the domain and the range.
Background
Topic: Relations and Functions
This question asks you to determine if a set of ordered pairs is a function, and to identify the domain and range.
Key Terms:
Domain: The set of all possible input values (x-values).
Range: The set of all possible output values (y-values).
Function: Each input has exactly one output.
Step-by-Step Guidance
For each relation, list all the x-values (domain) and y-values (range).
Check if any x-value is paired with more than one y-value. If so, it is not a function.
If each x-value is paired with only one y-value, it is a function.
Try solving on your own before revealing the answer!
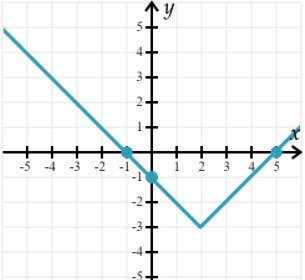
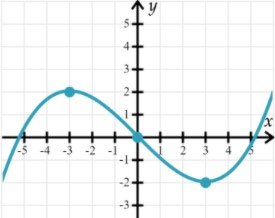
Q18. The graph of the function g is shown here.
Background
Topic: Graph Analysis – Increasing/Decreasing Intervals, Even/Odd Functions
This question asks you to analyze a graph to determine where the function is increasing, decreasing, or constant, and whether it is even, odd, or neither.
Key Terms:
Increasing Interval: Where the graph rises as you move left to right.
Decreasing Interval: Where the graph falls as you move left to right.
Constant Interval: Where the graph is flat (horizontal).
Even Function: Symmetric about the y-axis.
Odd Function: Symmetric about the origin.
Step-by-Step Guidance
Look at the graph and identify the intervals where the function is going up (increasing) or down (decreasing).
Check for any flat (horizontal) sections to determine constant intervals.
Examine the graph for symmetry about the y-axis (even) or origin (odd).
To evaluate and , find the y-values at and on the graph.
Try solving on your own before revealing the answer!
