Back
BackExponential and Logarithmic Functions: Study Guide
Study Guide - Smart Notes
 Tailored notes based on your materials, expanded with key definitions, examples, and context.
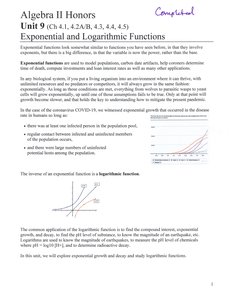
Exponential and Logarithmic Functions
Introduction to Exponential Functions
Exponential functions are mathematical models used to describe situations where quantities grow or decay at a constant percentage rate per unit time. These functions are essential in modeling population growth, radioactive decay, and financial investments, among other applications.
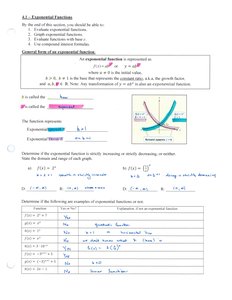
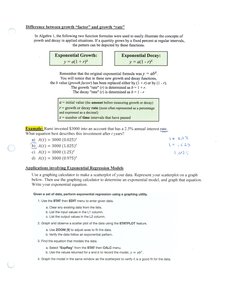
Exponential Function: A function of the form , where , , and .
Exponential Growth: Occurs when .
Exponential Decay: Occurs when .
Logarithmic Function: The inverse of an exponential function, written as .
Additional info: Exponential models are widely used in epidemiology, finance, and natural sciences to predict future outcomes based on current trends.
Exploring Exponential Growth and Decay
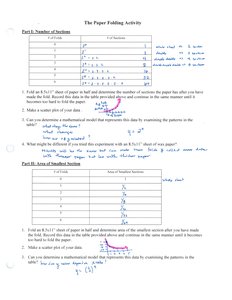
Paper Folding Activity
This activity demonstrates exponential growth by folding a sheet of paper and observing the number of sections and the area of each section after each fold.
Number of Folds (n) | Number of Sections |
|---|---|
0 | 1 |
1 | 2 |
2 | 4 |
3 | 8 |
4 | 16 |
5 | 32 |
Each fold doubles the number of sections, illustrating growth.
The area of each section is halved with each fold, showing exponential decay.
Example: After 3 folds, there are sections, and each section has the original area.
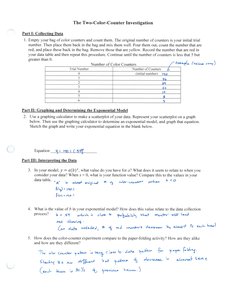
Two-Color Counter Investigation
This experiment models exponential decay by repeatedly removing a portion of colored counters and recording the remaining amount.
Trial | Number of Red Counters |
|---|---|
0 | 20 |
1 | 10 |
2 | 5 |
3 | 2.5 |
4 | 1.25 |
The number of counters is halved each time, modeled by .
Properties and Graphs of Exponential Functions
General Form and Characteristics
The general form of an exponential function is .
Domain:
Range: for
Y-intercept:
Horizontal Asymptote:
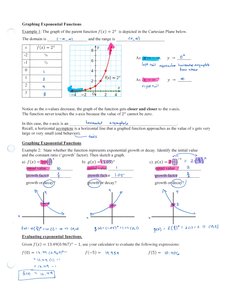
Graphing Exponential Functions
To graph , plot several points and observe the rapid increase as increases. The graph approaches the x-axis but never touches it.
As , .
As , .
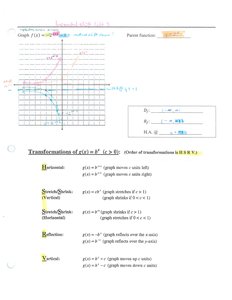
Transformations of Exponential Functions
Transformations include horizontal and vertical shifts, reflections, and stretches/compressions.
Horizontal Shift: shifts right by units.
Vertical Shift: shifts up by units.
Reflection: reflects over the x-axis.
Stretch/Compression: stretches if , compresses if .
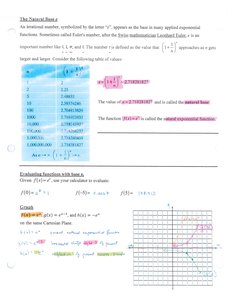
The Natural Base and Euler's Number
The Number
The number is an irrational constant that arises naturally in continuous growth and decay processes. The function is called the natural exponential function.
Continuous Growth/Decay: , where is the initial amount, is the rate, and is time.
Exponential Growth and Decay Models
Growth vs. Decay
Exponential Growth | Exponential Decay |
|---|---|
Growth rate | Decay rate |
Growth: Population, investments, and compound interest.
Decay: Radioactive decay, depreciation, and cooling.
Applications of Exponential Models
Exponential models are used to solve real-world problems such as population growth, radioactive decay, and financial investments.
Identify the initial value and rate of change.
Write the exponential equation and solve for unknowns.
Example: calculates the value of an account after 5 years at 3% interest.
Exponential Regression and Data Modeling
Fitting Exponential Models to Data
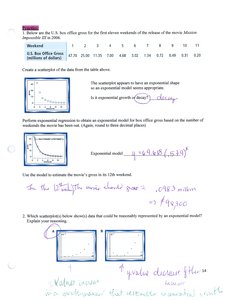
Exponential regression is used to find the best-fit exponential model for a set of data points. This is useful in pharmacokinetics, finance, and population studies.
Plot the data and observe the trend.
Use a calculator or software to perform exponential regression and obtain the model equation.
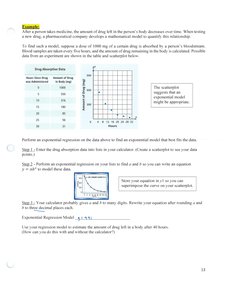
Interpreting Exponential Models in Context
Analyze the meaning of the parameters in the context of the problem (e.g., initial value, rate of decay/growth).
Predict future values using the model.
Assess the appropriateness of the model for the data.
Identifying Function Types from Data
Linear, Quadratic, and Exponential Relationships
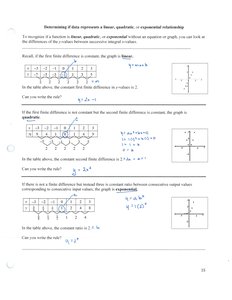
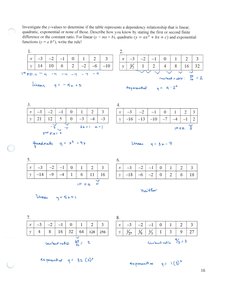
To determine if a data set is linear, quadratic, or exponential, examine the differences between consecutive y-values:
Linear: Constant first differences.
Quadratic: Constant second differences.
Exponential: Constant ratio between consecutive y-values.
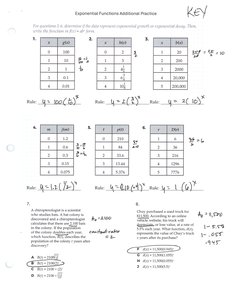
Practice Identifying Relationships
Given a table of values, calculate first and second differences or ratios to classify the relationship and write the corresponding equation.
For exponential:
For linear:
For quadratic:
Practice with Exponential Functions
Writing and Interpreting Exponential Equations
Given data or a scenario, identify the initial value, constant ratio, and write the exponential function. Use the model to make predictions and interpret results in context.