 Back
BackFunctions and Their Graphs: Foundations and Analysis
Study Guide - Smart Notes
 Tailored notes based on your materials, expanded with key definitions, examples, and context.
Functions and Graphs
Basics of Functions and Their Graphs
This section introduces the foundational concepts of functions, their graphical representations, and methods for analyzing their properties. Understanding these basics is essential for further study in algebra and calculus.
Domain: The set of all possible input values (x-values) for a relation or function.
Range: The set of all possible output values (y-values) for a relation or function.
Relation: Any set of ordered pairs. The domain consists of all first components, and the range consists of all second components.
Function: A relation in which each element of the domain corresponds to exactly one element of the range.
Example: For the relation {(0, 187), (1, 212), (2, 225), (3, 238)}, the domain is {0, 1, 2, 3} and the range is {187, 212, 225, 238}.
Determining Whether a Relation is a Function
To determine if a relation is a function, check that no two ordered pairs have the same first component with different second components. If each input has exactly one output, the relation is a function.
Example: The relation {(1, 2), (3, 4), (6, 5), (8, 5)} is a function because each x-value is paired with only one y-value.
Functions as Equations
An equation represents a function if, for every value of x in the domain, there is only one corresponding value of y. If an equation yields more than one y for a given x, it does not define y as a function of x.
Function Notation
Function notation uses the symbol f(x), read as "f of x," to denote the value of the function at x. This notation is standard for expressing functions in mathematics.
Example: If , then .
Graphing Functions by Plotting Points
The graph of a function consists of all ordered pairs (x, f(x)). To graph a function, create a table of values, plot the points, and connect them smoothly if the function is continuous.
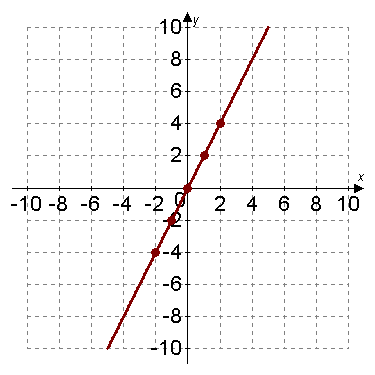
Example: For , plot points for several x-values and connect them to form a straight line.
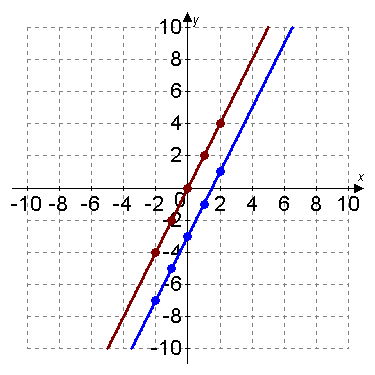
Comparing Graphs of Functions
Graphs can be compared to observe transformations such as shifts. For example, the graph of is the graph of shifted downward by 3 units.
The Vertical Line Test for Functions
The vertical line test is a graphical method to determine if a graph represents a function. If any vertical line intersects the graph at more than one point, the graph does not represent a function.
Key Point: A function can have only one output for each input; thus, no vertical line should cross the graph more than once.
Obtaining Information from a Function's Graph
Graphs provide valuable information about a function, including its domain, range, and intercepts. By analyzing the graph, one can determine these properties visually.
Identifying Domain and Range from a Function’s Graph
To find the domain, look for all x-values with corresponding points on the graph. To find the range, look for all y-values that the graph attains.

Identifying Intercepts from a Function’s Graph
Intercepts are points where the graph crosses the axes:
x-intercepts: Points where the graph crosses the x-axis (y = 0).
y-intercept: The point where the graph crosses the y-axis (x = 0). A function can have multiple x-intercepts but at most one y-intercept.
Example: If a graph passes through (–3, 0), (–1, 0), and (2, 0), these are x-intercepts. If it passes through (0, –6), this is the y-intercept.
