Back
BackFunctions and Their Properties: College Algebra Review
Study Guide - Smart Notes
 Tailored notes based on your materials, expanded with key definitions, examples, and context.
Functions and Their Properties
Evaluating Functions at Indicated Values
Evaluating a function means substituting a given value for the variable and simplifying the result. This is a foundational skill in algebra, as it allows us to determine the output of a function for specific inputs.
Key Point 1: Substitute the given value into the function wherever the variable appears.
Key Point 2: Simplify the resulting expression to find the function's value at that input.
Example: If \( f(x) = x^2 + 3 \), then \( f(2) = 2^2 + 3 = 7 \).
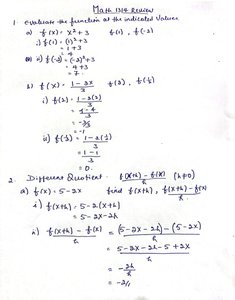
The Difference Quotient
The difference quotient is a formula that measures the average rate of change of a function over an interval. It is foundational for calculus but also important in algebra for understanding how functions change.
Definition: The difference quotient for a function \( f(x) \) is given by:
Key Point 1: Compute \( f(x+h) \) by replacing every \( x \) in the function with \( x+h \).
Key Point 2: Subtract \( f(x) \) from \( f(x+h) \), then divide by \( h \).
Example: For \( f(x) = 5 - 2x \),
Domain of a Function
The domain of a function is the set of all possible input values (x-values) for which the function is defined. Determining the domain is essential for understanding where a function can be used.
Key Point 1: For rational functions, exclude values that make the denominator zero.
Key Point 2: For even roots (like square roots), exclude values that make the radicand negative.
Example: For \( f(x) = \frac{x}{x-3} \), the domain is all real numbers except \( x = 3 \).
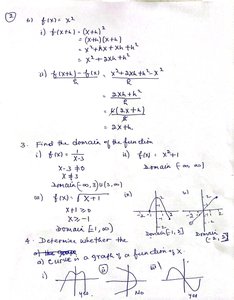
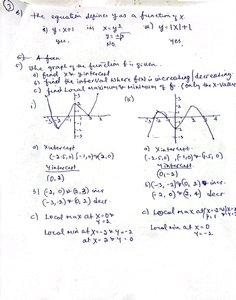
Determining Whether a Graph is a Function
A graph represents a function if and only if every vertical line intersects the graph at most once (the vertical line test).
Key Point 1: If any vertical line crosses the graph more than once, it is not a function.
Key Point 2: Equations can sometimes be solved for \( y \) in terms of \( x \) to check if they define functions.
Example: The graph of \( y = x^2 \) is a function, but the graph of \( x = y^2 \) is not.
Analyzing Graphs of Functions
Analyzing a function's graph involves identifying intercepts, intervals of increase and decrease, and local maxima and minima.
Key Point 1: Intercepts: Points where the graph crosses the axes.
Key Point 2: Increasing/Decreasing Intervals: Where the graph rises or falls as you move left to right.
Key Point 3: Local Maxima/Minima: Highest or lowest points in a local region of the graph.
Example: For a parabola opening upwards, the vertex is a local minimum.
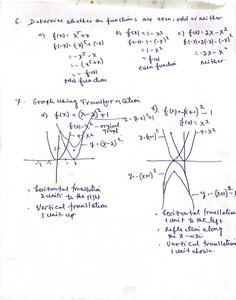
Even, Odd, and Neither Functions
Functions can be classified as even, odd, or neither based on their symmetry properties.
Even Function: \( f(-x) = f(x) \) for all \( x \) in the domain. Graph is symmetric about the y-axis.
Odd Function: \( f(-x) = -f(x) \) for all \( x \) in the domain. Graph is symmetric about the origin.
Neither: If neither condition holds, the function is neither even nor odd.
Example: \( f(x) = x^2 \) is even; \( f(x) = x^3 \) is odd.
Graphing Using Transformations
Transformations shift or stretch the graph of a function. Understanding these helps in quickly sketching graphs of related functions.
Key Point 1: Horizontal Translation: \( f(x - h) \) shifts the graph right by \( h \) units.
Key Point 2: Vertical Translation: \( f(x) + k \) shifts the graph up by \( k \) units.
Key Point 3: Reflection: \( -f(x) \) reflects the graph over the x-axis; \( f(-x) \) reflects over the y-axis.
Example: \( y = (x-2)^2 + 1 \) is the graph of \( y = x^2 \) shifted right 2 units and up 1 unit.