 Back
BackFunctions and Their Representations: College Algebra Study Notes
Study Guide - Smart Notes
 Tailored notes based on your materials, expanded with key definitions, examples, and context.
Functions and Their Representations
Definition of a Function
A function is a relation in which each element in the domain corresponds to exactly one element in the range. This means that for every input value (usually denoted as x), there is only one output value (usually denoted as y).
Domain: The set of all possible input values (typically x).
Range: The set of all possible output values (typically y).
Independent variable: Usually x.
Dependent variable: Usually y.
Function Notation: Functions are often written as f(x) or g(x), where x is the input and f(x) is the output.
Graphical Representation and the Vertical Line Test
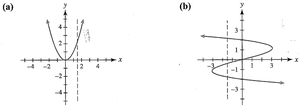
Functions can be represented graphically. The vertical line test is used to determine if a graph represents a function: if every vertical line intersects the graph at most once, the graph is a function.
Example: A graph of y = x^2 passes the vertical line test, so it is a function.
Counterexample: A graph where a vertical line crosses more than once (such as a sideways parabola) is not a function.
Four Representations of a Function
Functions can be represented in four main ways:
Verbal: Describing the function in words.
Symbolic: Using equations, e.g., .
Numerical: Using tables of values.
Graphical: Using graphs to show the relationship.
Domain and Range
The domain of a function is the set of all possible input values. The range is the set of all possible output values. For most basic functions, the domain is all real numbers unless restricted by the function's form (such as division by zero or taking the square root of a negative number).
Example: For , the domain is all real numbers.
Implied Domain: In real-world applications, values outside the realm of possibilities are excluded from the domain.
Interval Notation
Interval notation is used to describe subsets of the real numbers, often for domains and ranges.
Open interval: means all numbers between a and b, not including a or b.
Closed interval: means all numbers between a and b, including a and b.
Half-open interval: or includes one endpoint.
All real numbers: .
Examples and Applications
Example 1: Given the set {(1, 2), (–3, 4), (–7, 2), (2, 8), (–3, 5)}, this is not a function because the input –3 corresponds to two different outputs (4 and 5).
Example 2: For the table:
x
y
5
1
6
1
7
1
8
1
This is a function because each input has only one output.
Evaluating Functions
To evaluate a function, substitute the input value into the function's formula.
Example: For , to find :
Substitute:
Summary Table: Function Properties
Property | Description |
|---|---|
Function | Each input has one output |
Domain | Set of possible inputs |
Range | Set of possible outputs |
Vertical Line Test | Graph test for functions |
Interval Notation | Describes domain/range |
Additional info: The notes cover foundational concepts from Chapter 1: Introduction to Functions and Graphs, including definitions, representations, and properties of functions, as well as domain and range. The included images directly illustrate the vertical line test and the graph of a function, reinforcing the explanations.
