 Back
BackFunctions and Their Transformations: Foundations of College Algebra
Study Guide - Smart Notes
 Tailored notes based on your materials, expanded with key definitions, examples, and context.
Functions and Function Notation
Definition and Representation of Functions
A function is a rule that assigns each input (independent variable) exactly one output (dependent variable). Functions can be represented in various ways: words, tables, graphs, or formulas.
Input (independent variable): The value you provide to the function.
Output (dependent variable): The value the function returns for a given input.
Function Notation: If f is a function and x is the input, then the output is written as f(x).
Example: If h is height and a is age, then h = f(a) means height is a function of age.
One-to-One Functions
A function is one-to-one if each output value corresponds to exactly one input value. This means no two different inputs produce the same output.
Vertical Line Test: A graph represents a function if no vertical line crosses it more than once.
Horizontal Line Test: A function is one-to-one if no horizontal line crosses its graph more than once.
Evaluating and Solving Functions
Evaluating: Substitute a specific input value into the function to find the output.
Solving: Find all input values that produce a given output value.
Toolkit Functions and Their Graphs
Basic Toolkit Functions
Recognizing the basic shapes and equations of common functions is essential in algebra. Here are the most important toolkit functions:
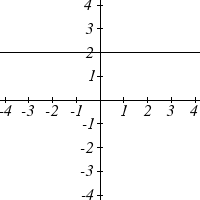
Constant Function:
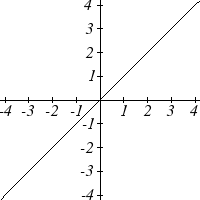
Identity Function:
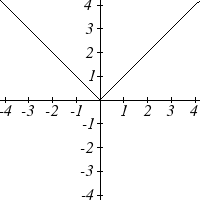
Absolute Value Function:
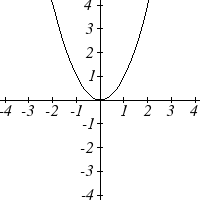
Quadratic Function:
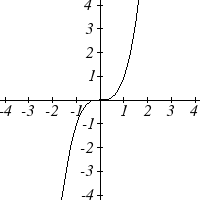
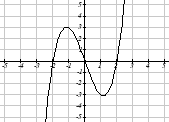
Cubic Function:
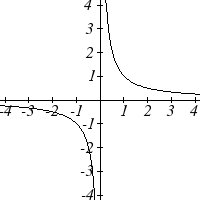
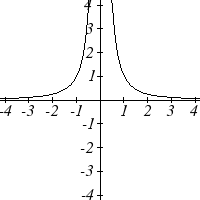
Reciprocal Function:
Reciprocal Squared Function:
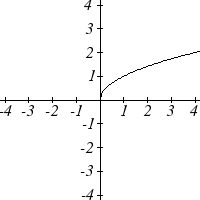
Square Root Function:
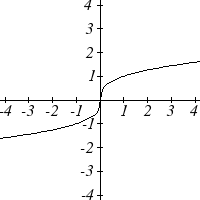
Cube Root Function:
Below are the graphs of several toolkit functions:
Constant Function:
Identity Function:
Absolute Value Function:
Quadratic Function:
Cubic Function:
Square Root Function:
Cube Root Function:
Reciprocal Function:
Reciprocal Squared Function:
Transformations of Functions
Vertical and Horizontal Shifts
Transformations allow us to modify basic functions to model new situations.
Vertical Shift: shifts the graph up by units; shifts it down by units.
Horizontal Shift: shifts the graph left by units; shifts it right by units.
Example: shifts the graph of right by 2 units.
Reflections
Vertical Reflection: reflects the graph over the x-axis.
Horizontal Reflection: reflects the graph over the y-axis.
Stretches and Compressions
Vertical Stretch/Compression: stretches the graph vertically by if , compresses if .
Horizontal Stretch/Compression: compresses the graph horizontally by if , stretches if .
Combining Transformations
Multiple transformations can be combined. The order of operations is important, especially for horizontal transformations. Factoring inside the function can help clarify the sequence.
Graphs and Function Properties
Recognizing Functions from Graphs
To determine if a graph represents a function, use the vertical line test. For one-to-one functions, use the horizontal line test.
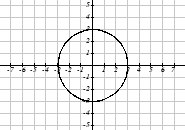
Example: The following graphs illustrate functions and non-functions, as well as one-to-one and not one-to-one functions.
Function, not one-to-one:
One-to-one function:
Not a function (circle):
Even and Odd Functions
Even Function: ; symmetric about the y-axis.
Odd Function: ; symmetric about the origin.
Linear Functions and Their Graphs
Definition and Structure
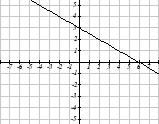
A linear function is a function whose graph is a straight line. It can be written as , where is the slope (rate of change) and is the y-intercept (initial value).
Increasing function:
Decreasing function:
Constant function:
Graphing Linear Functions
Plot the y-intercept .
Use the slope to find another point.
Draw a straight line through the points.
Example: has a y-intercept at and a slope of .
Special Linear Graphs
Horizontal Line: (slope )
Vertical Line: (not a function)
Graph of a horizontal line:
Graph of a vertical line: 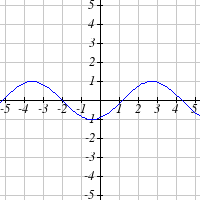
Parallel and Perpendicular Lines
Parallel lines: Same slope ()
Perpendicular lines: Slopes are negative reciprocals ()
Applications and Modeling
Mathematical Modeling with Linear Functions
Linear functions are used to model real-world situations where there is a constant rate of change. The general steps for modeling are:
Identify variables and define them clearly.
Determine the initial value and rate of change.
Write the function equation.
Interpret the function in context.
Example: A taxi fare starts at C(m) = 3.30 + 2.40m$.
Summary Table: Toolkit Functions and Their Graphs
Function Name | Equation | Graph |
|---|---|---|
Constant |
| |
Identity |
| |
Absolute Value |
| |
Quadratic |
| |
Cubic |
| |
Square Root |
| |
Cube Root |
| |
Reciprocal |
| |
Reciprocal Squared |
|
Additional info:
Images included above are only those that directly illustrate the function types and transformations discussed in the text, as required for clarity and direct relevance.
Other images in the provided set were not included because they do not directly reinforce the core concepts or are not clearly referenced in the explanations above.
