 Back
BackGraphing the Solution Set of a System of Inequalities
Study Guide - Smart Notes
 Tailored notes based on your materials, expanded with key definitions, examples, and context.
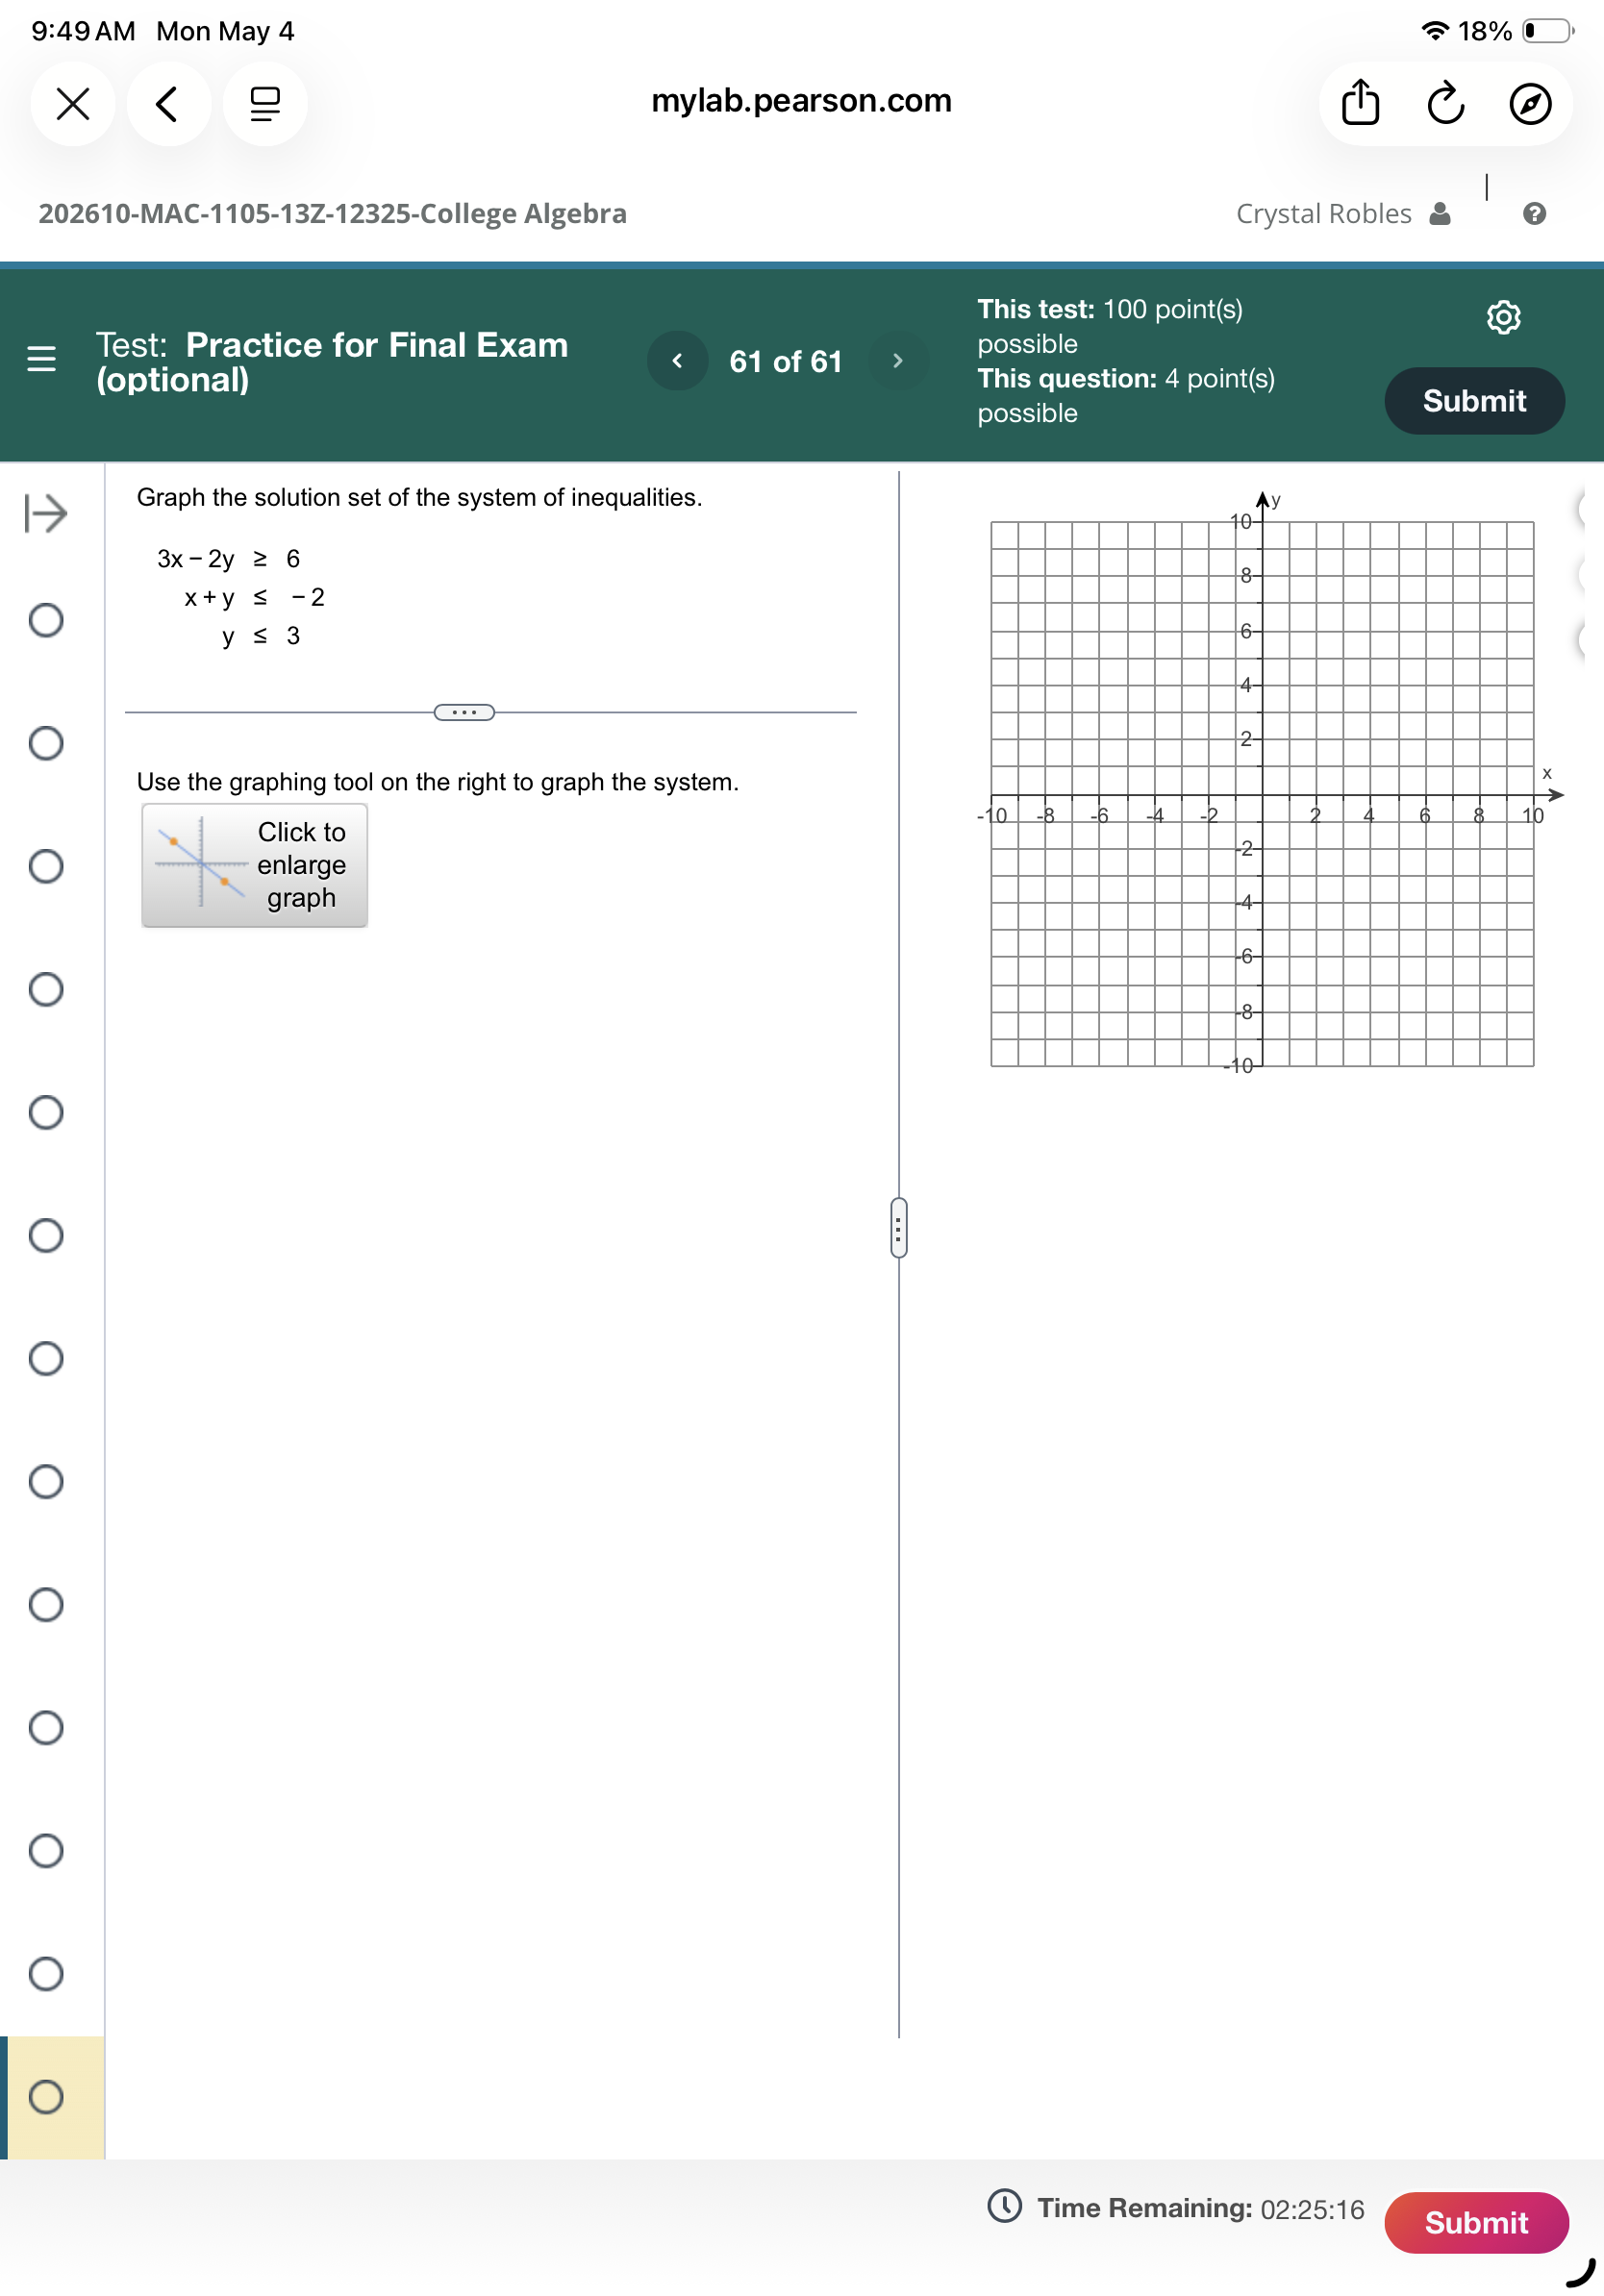
Q1. Graph the solution set of the system of inequalities:
Background
Topic: Systems of Linear Inequalities and Graphing
This question tests your ability to graph multiple linear inequalities on the same coordinate plane and identify the region that satisfies all the inequalities simultaneously. This is a key skill in college algebra, especially for understanding feasible regions in linear programming and systems analysis.
Key Terms and Formulas
Linear Inequality: An inequality that involves a linear function. The solution is a region of the coordinate plane.
Boundary Line: The line corresponding to the equation when the inequality is replaced with equality (e.g., ).
Shading: The region that satisfies the inequality. Use a solid line for or and a dashed line for or .
Step-by-Step Guidance
Rewrite each inequality in slope-intercept form () if possible:
For , solve for :
Subtract from both sides:
Divide both sides by (remember to reverse the inequality sign):
Rewrite the second inequality:
Solve for :
The third inequality is already in slope-intercept form:
Graph each boundary line on the coordinate plane:
For each inequality, graph the corresponding line as a solid line (since all are or ).
For , plot the line .
For , plot the line .
For , plot the horizontal line .
Determine which side of each line to shade:
For inequalities, shade below the line.
The solution set is the region where all shaded areas overlap.
Try solving on your own before revealing the answer!
Final Answer:
The solution set is the region where all three shaded areas overlap. This region is bounded by the lines , , and , and includes all points that satisfy all three inequalities.
On the graph, this is the area below all three lines, with the boundaries included (solid lines).
