 Back
BackGraphs and Functions: College Algebra Study Guide
Study Guide - Smart Notes
 Tailored notes based on your materials, expanded with key definitions, examples, and context.
Graphs and Functions
Rectangular Coordinate System
The rectangular coordinate system, also known as the Cartesian plane, is fundamental for graphing equations and functions in two dimensions. It consists of two perpendicular axes: the horizontal x-axis and the vertical y-axis. Points are plotted as ordered pairs (x, y), with the origin at (0, 0) where the axes intersect.
Quadrants: The axes divide the plane into four quadrants, numbered counter-clockwise starting from the top-right.
Positive/Negative Values: x-values to the right of the origin are positive; to the left are negative. y-values above the origin are positive; below are negative.
Example: Plotting points such as A(4, 3), B(−3, 2), C(−2, −3), D(5, −4), E(0,0), F(0, −3) demonstrates the use of ordered pairs.
Functions and Their Graphs
Relations and Functions
A relation is any set of ordered pairs (x, y). A function is a special relation where each input (x) has at most one output (y).
Vertical Line Test (VLT): If any vertical line crosses the graph more than once, it is not a function.
Function Notation: replaces y, e.g., .
Example: is a function; is not.
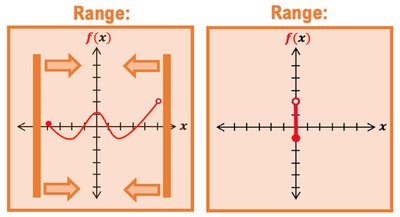
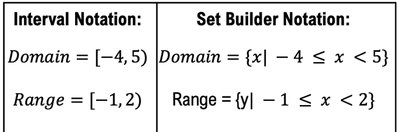
Domain and Range
The domain of a function is the set of allowed x-values; the range is the set of allowed y-values. To find domain, project the graph onto the x-axis; for range, project onto the y-axis. Use interval notation or set builder notation to express these sets.
Interval Notation: means all x from -4 (included) to 5 (not included).
Set Builder Notation:
Union Symbol: is used for multiple intervals.
Finding Domain from Equations
When given an equation, find domain by identifying restrictions:
For square roots: x-values must not make the radicand negative.
For fractions: x-values must not make the denominator zero.
Example: has domain .
Equations of Two Variables
Solving and Graphing Two Variable Equations
Equations with two variables (x and y) represent all points (x, y) that satisfy the equation. To check if a point satisfies an equation, substitute x and y and see if the equation holds true.
Graphing by Plotting Points: Isolate y, choose x-values, calculate corresponding y-values, plot points, and connect with a line or curve.
Intercepts: x-intercept is where y = 0; y-intercept is where x = 0.
Lines
Slopes of Lines
The slope measures the steepness of a line, calculated as the change in y divided by the change in x between two points:
Types of Slope: Positive (upward), negative (downward), zero (horizontal), undefined (vertical).
Slope-Intercept Form
The slope-intercept form of a line is , where m is the slope and b is the y-intercept.
Graphing: Plot the y-intercept, use the slope to find another point, and draw the line.
Point-Slope Form
Use point-slope form when given a point (x1, y1) and the slope m:
Standard Form of a Line
Standard form is . To find slope or intercepts, solve for y or set x/y to zero.
Parallel and Perpendicular Lines
Parallel lines have equal slopes; perpendicular lines have slopes that are negative reciprocals.
for parallel lines
for perpendicular lines
Common Functions
Graphs of Common Functions
Several basic functions frequently appear in algebra:
Constant Function:
Identity Function:
Square Function:
Cube Function:
Square Root Function:
Cube Root Function:
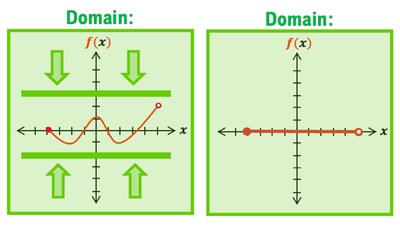
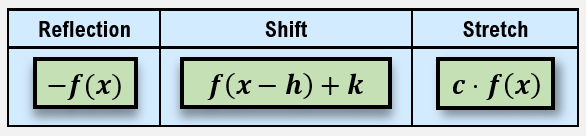
Transformations of Functions
Types of Transformations
Transformations change the position or shape of a function's graph. The main types are:
Reflection: Flips the graph over the x-axis or y-axis.
Shift: Moves the graph horizontally or vertically.
Stretch/Shrink: Changes the graph's size.
Domain and Range of Transformed Functions
Transformations can affect the domain and range. Analyze the new graph to determine these sets.
Function Operations
Adding, Subtracting, Multiplying, and Dividing Functions
Functions can be combined by addition, subtraction, multiplication, and division. The domain of the resulting function is the set of values common to the domains of the original functions, with additional restrictions for division (denominator ≠ 0).
Add/Subtract: Combine like terms.
Multiply: Multiply expressions.
Divide: ; exclude x-values where .
Function Composition and Decomposition
Function Composition
Function composition involves substituting one function into another: . The domain is restricted by both functions.
Decomposition: Express a function as a composition of two simpler functions.
