 Back
BackGraphs and Functions: Foundations for College Algebra
Study Guide - Smart Notes
 Tailored notes based on your materials, expanded with key definitions, examples, and context.
Graphs and the Rectangular Coordinate System
Introduction to the Rectangular Coordinate System
The rectangular coordinate system, also known as the Cartesian plane, is a two-dimensional plane formed by two perpendicular number lines: the horizontal x-axis and the vertical y-axis. This system is fundamental for graphing equations and visualizing relationships between variables in algebra.
Axes: The horizontal axis is the x-axis; the vertical axis is the y-axis.
Ordered pairs: Points are written as (x, y).
Origin: The point (0, 0) where the axes intersect.
Quadrants: The axes divide the plane into four quadrants, numbered I to IV counterclockwise starting from the upper right.
Signs: x-values are positive to the right of the origin and negative to the left; y-values are positive above the origin and negative below.
Example: Plotting points such as A(4, 3), B(−3, 2), C(−2, −3), D(5, −4), E(0, 0), and F(0, −3) helps illustrate the use of the coordinate plane.
Circles in the Coordinate Plane
Standard Form of a Circle
A circle is the set of all points in a plane that are a fixed distance (radius) from a fixed point (center). The standard equation for a circle with center (h, k) and radius r is:
Center: (h, k)
Radius: r
Example: The equation describes a circle with center (1, 2) and radius 3.
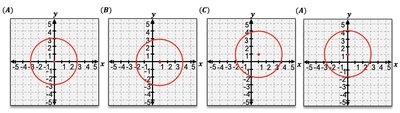
Note: A circle is not a function because it fails the Vertical Line Test (VLT).
General Form to Standard Form
Sometimes, a circle's equation is given in general form:
To convert to standard form, complete the square for both x and y terms.
Group x and y terms.
Add the necessary constants to both sides to complete the square.
Rewrite as .
Example: Convert to standard form:
Introduction to Functions and Their Graphs
Relations and Functions
A relation is any set of ordered pairs (x, y). A function is a special relation where each input (x) has at most one output (y).
Vertical Line Test (VLT): A graph is a function if no vertical line intersects it more than once.
Example: The relation {(−3, 5), (0, 2), (3, 5)} is a function, but {(2, 5), (0, 2), (2, 9)} is not (since x = 2 has two outputs).
Function Notation and Verification
Functions are often written as instead of y. To verify if an equation is a function, solve for y and check if each x yields only one y.
If y is raised to an even power, the equation is usually not a function.
Linear equations (y = mx + b) are always functions.
Domain and Range
Finding Domain and Range from Graphs
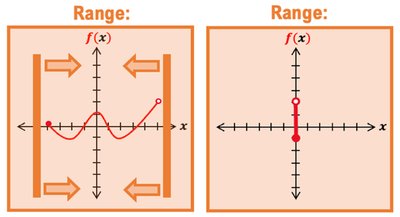
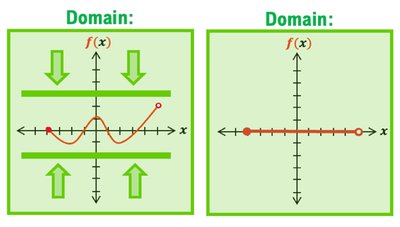
The domain of a function is the set of all possible x-values; the range is the set of all possible y-values.
To find the domain, project the graph onto the x-axis.
To find the range, project the graph onto the y-axis.
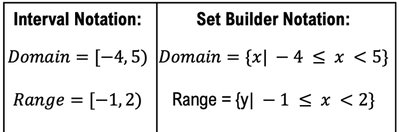
Use interval notation or set builder notation to express answers.
Domain from Equations
For square roots: x-values must make the radicand non-negative.
For denominators: x-values must not make the denominator zero.
Example: For , the domain is all real numbers except x = 5.
Equations of Two Variables
Graphing and Satisfying Equations
Equations with two variables (x and y) can be graphed as sets of points (x, y) that satisfy the equation. To check if a point is on the graph, substitute its coordinates into the equation.
If the equation is true, the point is on the graph.
If not, the point is not on the graph.
Graphing by Plotting Points
Isolate y if possible.
Choose several x-values, compute corresponding y-values, and plot the points.
Connect the points to reveal the graph.
Lines and Their Equations
Slope of a Line
The slope (m) measures the steepness of a line:
Positive slope: line rises left to right.
Negative slope: line falls left to right.
Zero slope: horizontal line.
Undefined slope: vertical line.
Forms of Linear Equations
Slope-Intercept Form:
Point-Slope Form:
Standard Form:
To graph a line, identify the y-intercept (b) and use the slope (m) to find another point.
Parallel and Perpendicular Lines
Parallel lines have equal slopes ().
Perpendicular lines have slopes that are negative reciprocals ().
Common Functions and Their Graphs
Basic Function Types
Constant Function:
Identity Function:
Square Function:
Cube Function:
Square Root Function:
Cube Root Function:
Transformations of Functions
Types of Transformations
Transformations change the position or shape of a function's graph. The main types are:
Reflection | Shift | Stretch |
|---|---|---|
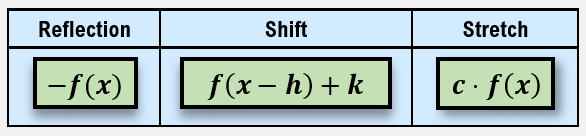
Reflection: Flips the graph over the x-axis or y-axis.
Shift: Moves the graph horizontally (h) or vertically (k).
Stretch/Shrink: Multiplies the function by a constant, changing its steepness or width.
Example: shifts the graph right by 3 and up by 2.
Domain and Range of Transformed Functions
Transformations can affect the domain and range. Analyze the new graph to determine these sets.
Function Operations
Adding, Subtracting, Multiplying, and Dividing Functions
Add/Subtract: Combine like terms. The domain is the intersection of the domains of the original functions.
Multiply/Divide: Multiply or divide the outputs. For division, exclude x-values where the denominator is zero.
Function Composition and Decomposition
Function Composition
Function composition involves substituting one function into another: . The domain is restricted to values where both functions are defined.
Notation:
Evaluate inside function first, then outside.
Function Decomposition
Decomposition is the reverse process: expressing a function as a composition of two or more simpler functions.
Additional info: These notes cover the essential concepts from Chapter 2 of a college algebra course, focusing on graphs, functions, equations, and transformations. All images included directly reinforce the explanation of domain, range, and transformations as required for college algebra students.
