 Back
BackGraphs and Functions: Study Notes for College Algebra
Study Guide - Smart Notes
 Tailored notes based on your materials, expanded with key definitions, examples, and context.
Graphs and Functions
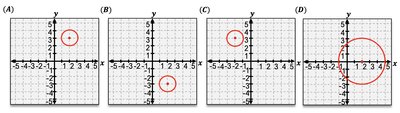
Rectangular Coordinate System
The rectangular coordinate system, also known as the Cartesian plane, is a two-dimensional plane formed by two perpendicular axes: the horizontal x-axis and the vertical y-axis. Points are plotted as ordered pairs (x, y), where the origin (0, 0) is the intersection of the axes. The plane is divided into four quadrants, numbered counterclockwise starting from the top right.
x-values are positive to the right of the origin and negative to the left.
y-values are positive above the origin and negative below.
Quadrants are labeled I, II, III, and IV.
Example: The point (4, 3) is in Quadrant I; (−3, 2) is in Quadrant II.
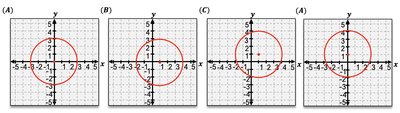
Circles in the Coordinate Plane
A circle is the set of all points in a plane that are a fixed distance (radius, r) from a fixed point (center, C). The standard form of a circle's equation is:
(h, k) is the center of the circle.
r is the radius.
Example: has center (1, 2) and radius 3.
A circle is not a function because it fails the Vertical Line Test (VLT).
General Form to Standard Form of a Circle
Sometimes, a circle's equation is given in general form: . To convert to standard form, complete the square for both x and y terms:
Group x and y terms on the left; move the constant to the right.
Add the necessary values to both sides to complete the square.
Factor and simplify to standard form.
Example: becomes after completing the square.
Introduction to Functions and Their Graphs
Relations and Functions
A relation is a set of ordered pairs (x, y). A function is a special relation where each input (x) has at most one output (y). The Vertical Line Test (VLT) is used to determine if a graph represents a function: if any vertical line crosses the graph more than once, it is not a function.
Example: is a function; is not.
Function Notation
Functions are often written as instead of y. For example, can be written as .
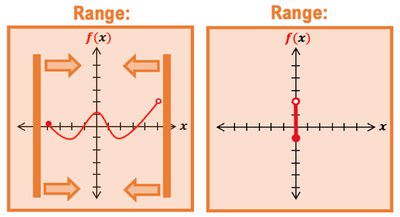
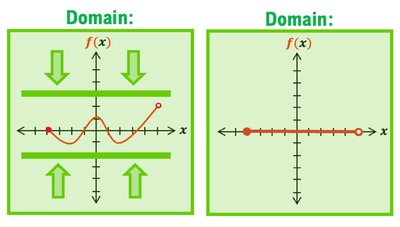
Domain and Range
The domain of a function is the set of all possible input (x) values, and the range is the set of all possible output (y) values. To find the domain, project the graph onto the x-axis; for the range, project onto the y-axis. Use interval notation or set builder notation to express these sets.
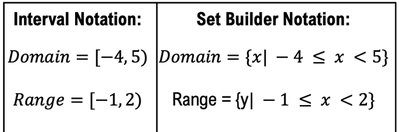
Interval Notation: means all x from -4 (inclusive) to 5 (exclusive).
Set Builder Notation: .
Finding Domain from Equations
For square roots: The expression inside must be non-negative.
For denominators: The denominator cannot be zero.
Example: has domain .
Example: has domain .
Lines
Slopes of Lines
The slope (m) of a line measures its steepness and is calculated as the change in y divided by the change in x between two points:
Positive slope: line rises left to right.
Negative slope: line falls left to right.
Zero slope: horizontal line.
Undefined slope: vertical line.
Forms of Linear Equations
Slope-Intercept Form:
Point-Slope Form:
Standard Form:
To graph a line, identify the y-intercept (where x = 0) and use the slope to find another point.
Parallel and Perpendicular Lines
Parallel lines have equal slopes ().
Perpendicular lines have slopes that are negative reciprocals ().
Common Functions and Their Graphs
Common Functions
Constant Function:
Identity Function:
Square Function:
Cube Function:
Square Root Function:
Cube Root Function:
Transformations of Functions
Types of Transformations
Transformations change the position or shape of a function's graph. The main types are:
Reflection | Shift | Stretch |
|---|---|---|
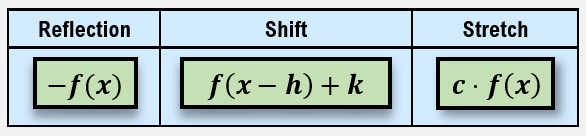
Reflection: Flips the graph over the x-axis or y-axis.
Shift: Moves the graph horizontally (h) or vertically (k).
Stretch/Shrink: Multiplies the function by a constant, changing its steepness or width.
Domain and Range of Transformed Functions
Transformations can affect the domain and range of a function. Analyze the new graph to determine these sets.
Function Operations
Adding, Subtracting, Multiplying, and Dividing Functions
Combine functions by performing operations on their outputs: , , , (where ).
The domain of the result is the intersection of the domains of the original functions (and for division, exclude where ).
Function Composition and Decomposition
Function Composition
Function composition involves substituting one function into another: . The domain of the composite function is the set of all x-values for which g(x) is in the domain of f.
Example: If and , then .
Function Decomposition
Decomposition is the process of expressing a function as a composition of two or more simpler functions. For example, can be written as where and .
