 Back
Key Concepts in Polynomial and Rational Functions for College Algebra
Study Guide - Smart Notes
 Tailored notes based on your materials, expanded with key definitions, examples, and context.
Polynomial Functions
Definition of a Polynomial Function
A polynomial function is an expression of the form , where is a nonnegative integer and the coefficients are real numbers, with . The degree of the polynomial is $n$, and is called the leading coefficient.
Polynomial Functions: All exponents are nonnegative integers.
Not Polynomial Functions: Exponents are not nonnegative integers or variables are under roots.
Examples:
(Polynomial function of degree 4)
(Polynomial function of degree 6)
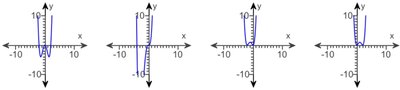
Graphs of Polynomial Functions
Graphs of polynomial functions are characterized by smooth, rounded corners and are continuous. Non-polynomial functions may have sharp corners or discontinuities.
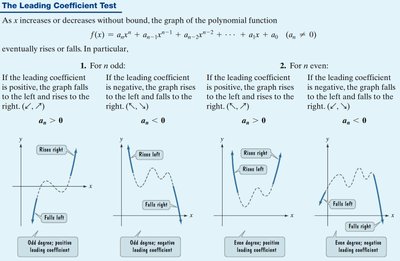
The Leading Coefficient Test
The leading coefficient test helps predict the end behavior of a polynomial function based on its degree and leading coefficient:
For odd degree polynomials:
If leading coefficient is positive, graph falls left and rises right.
If leading coefficient is negative, graph rises left and falls right.
For even degree polynomials:
If leading coefficient is positive, graph rises left and right.
If leading coefficient is negative, graph falls left and right.
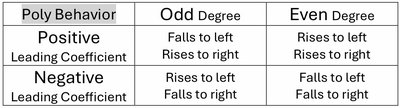
Poly Behavior | Odd Degree | Even Degree |
|---|---|---|
Positive Leading Coefficient | Falls to left, Rises to right | Rises to left, Rises to right |
Negative Leading Coefficient | Rises to left, Falls to right | Falls to left, Falls to right |
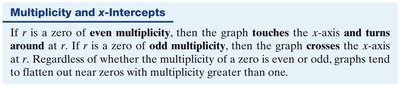
Multiplicity and x-Intercepts
If is a zero of even multiplicity, the graph touches the x-axis and turns around at . If $r$ is a zero of odd multiplicity, the graph crosses the x-axis at . Graphs flatten near zeros with multiplicity greater than one.
Polynomial Division and Theorems
Synthetic Division
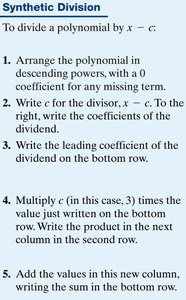
Synthetic division is a shortcut method for dividing a polynomial by a linear factor . The steps are:
Arrange the polynomial in descending powers, with a 0 coefficient for any missing term.
Write for the divisor . To the right, write the coefficients of the dividend.
Write the leading coefficient of the dividend on the bottom row.
Multiply times the value just written on the bottom row. Write the product in the next column in the second row.
Add the values in this new column, writing the sum in the bottom row.
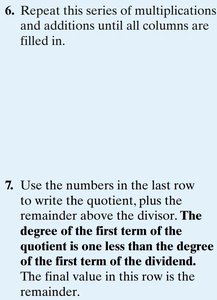
Repeat this series of multiplications and additions until all columns are filled in.
Use the numbers in the last row to write the quotient, plus the remainder above the divisor. The degree of the first term of the quotient is one less than the degree of the first term of the dividend. The final value in this row is the remainder.
The Remainder Theorem
The Remainder Theorem states: If the polynomial is divided by , then the remainder is .

The Factor Theorem
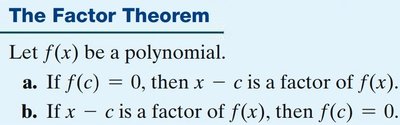
The Factor Theorem states:
If , then is a factor of .
If is a factor of , then .
Quadratic Functions and Equations
The Quadratic Formula
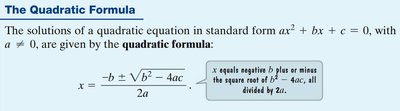
The solutions of a quadratic equation in standard form , with , are given by the quadratic formula:
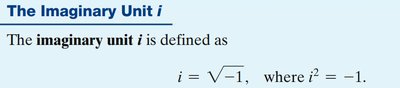
The Imaginary Unit i
The imaginary unit is defined as , where .
Vertex of a Parabola
The vertex of a parabola defined by is at . The x-coordinate is , and the y-coordinate is found by substituting this value into the function.


Rational Functions
Definition of Rational Functions
Rational functions are quotients of polynomial functions. They can be expressed as , where and are polynomials and .

Possible Rational Zeros
The possible rational zeros of a polynomial are given by:

Domain of Rational Functions
The domain of a rational function excludes values that make the denominator zero. For example:
: Domain excludes .
: Domain excludes and .
: Domain excludes values where (no real solutions).

Horizontal Asymptotes
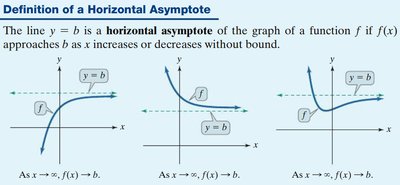
A horizontal asymptote is a line that the graph of a function approaches as increases or decreases without bound.
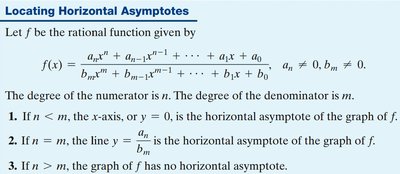
Locating Horizontal Asymptotes
For a rational function :
If , the x-axis () is the horizontal asymptote.
If , the line is the horizontal asymptote.
If , the graph has no horizontal asymptote.
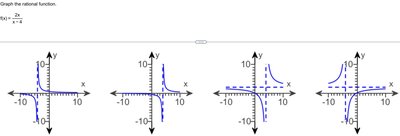
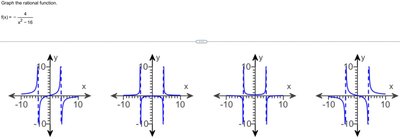
Graphing Rational Functions
Graphing rational functions involves identifying asymptotes, intercepts, and behavior near undefined points.
Applications of Quadratic Functions
Projectile Motion Example
Quadratic functions can model projectile motion, such as the height of an arrow over time. The maximum height occurs at the vertex of the parabola.
Profit Maximization Example
Quadratic functions can also model profit, where the maximum profit occurs at the vertex of the parabola.
Summary Table: Polynomial Behavior
Poly Behavior | Odd Degree | Even Degree |
|---|---|---|
Positive Leading Coefficient | Falls to left, Rises to right | Rises to left, Rises to right |
Negative Leading Coefficient | Rises to left, Falls to right | Falls to left, Falls to right |
Additional info:
All content is directly relevant to College Algebra topics, specifically polynomial and rational functions, their properties, and applications.
