 Back
BackLinear Equations in Two Variables and Functions: Graphs, Slope, and Rate of Change
Study Guide - Smart Notes
 Tailored notes based on your materials, expanded with key definitions, examples, and context.
Linear Equations in Two Variables
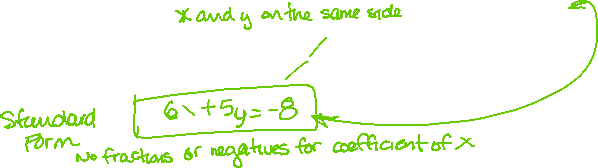
Standard Form of a Linear Equation
Linear equations in two variables are fundamental in algebra and are typically written in the standard form:
Standard Form: where A and B are real numbers, and not both zero.
This form is useful for quickly identifying intercepts and for certain algebraic manipulations.
To be in true standard form, the coefficient of x should be positive, and there should be no fractions.
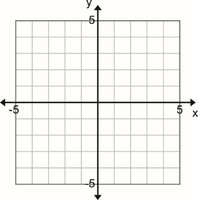
Graphing Linear Equations and Identifying Intercepts
To graph a linear equation, it is helpful to find the x-intercept (where the line crosses the x-axis) and the y-intercept (where the line crosses the y-axis). These points can be found by setting the other variable to zero and solving for the remaining variable.
x-intercept: Set and solve for .
y-intercept: Set and solve for .
Slopes of Lines
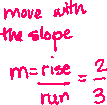
Definition and Calculation of Slope
The slope of a line measures its steepness and direction. It is defined as the ratio of the vertical change (rise) to the horizontal change (run) between two points on the line:
Formula:
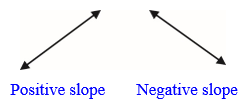
Positive slope: Line rises from left to right.
Negative slope: Line falls from left to right.
Zero slope: Horizontal line.
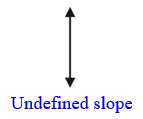
Undefined slope: Vertical line.
Special Cases of Slope
Horizontal Line: (where is a constant), slope .
Vertical Line: (where is a constant), slope is undefined.
Slope-Intercept Form of a Line
Definition and Use
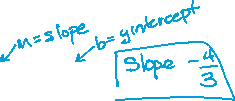
The slope-intercept form of a line is especially useful for graphing and quickly identifying the slope and y-intercept:
Form:
m: Slope of the line
b: y-intercept (the value of when )
Graphing Using Slope and Intercept
To graph a line using the slope-intercept form:
Plot the y-intercept on the y-axis.
Use the slope to find another point on the line.
Draw a straight line through the points.
Types of Slope
Classification of Slope
Positive Slope: Line rises from left to right.
Negative Slope: Line falls from left to right.
Zero Slope: Horizontal line.
Undefined Slope: Vertical line.
Average Rate of Change
Definition and Formula
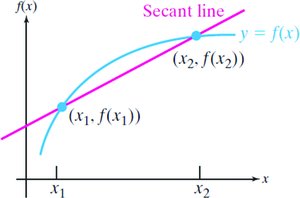
The average rate of change of a function over the interval is the slope of the secant line passing through the points and on the graph of $f$.
Formula:
This concept generalizes the idea of slope to nonlinear functions.
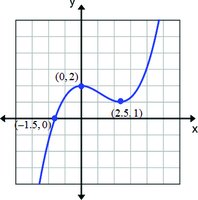
Example: Calculating Average Rate of Change
Given a function and two points, such as and , the average rate of change is:
Summary Table: Types of Lines and Their Slopes
Type of Line | Equation | Slope |
|---|---|---|
Slanted (positive/negative) | m (real number) | |
Horizontal | 0 | |
Vertical | Undefined |
