 Back
BackPiecewise-Defined Functions: Concepts, Evaluation, Graphs, and Applications
Study Guide - Smart Notes
 Tailored notes based on your materials, expanded with key definitions, examples, and context.
Piecewise-Defined Functions
Definition and Structure
A piecewise-defined function is a function composed of multiple equations, each applying to a specific interval or condition within the domain. The function's rule specifies which equation to use for each part of the domain.
Key Point 1: The function is defined by different expressions depending on the value of the independent variable (usually x).
Key Point 2: The rule includes both the equations and the conditions (such as inequalities or equalities) that determine which equation applies.
Example:
Evaluating Piecewise-Defined Functions
To evaluate a piecewise-defined function at a specific value, determine which condition the value satisfies and use the corresponding equation.
Key Point 1: Check the value of x against the conditions for each piece.
Key Point 2: Substitute the value into the appropriate equation.
Example: For :
(since )
(since )
(since )
Finding Intercepts of Piecewise-Defined Functions
Intercepts are points where the function crosses the axes. For piecewise-defined functions, check each piece for possible intercepts.
Key Point 1: x-intercepts: Set and solve for x in each piece.
Key Point 2: y-intercept: Evaluate using the appropriate piece.
Example: For , (y-intercept at (0,0)).
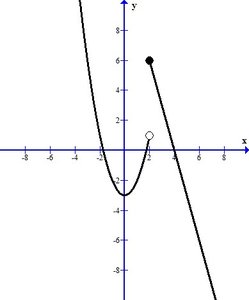
Graphing Piecewise-Defined Functions
Graphing a piecewise-defined function involves plotting each piece over its specified interval and marking any discontinuities or endpoints.
Key Point 1: Plot each equation only over its valid domain.
Key Point 2: Use open or closed circles to indicate whether endpoints are included or excluded.
Example: The graph of will show a parabola for and a straight line for , with appropriate endpoint markings.
Using Graphs to Determine Rules for Piecewise-Defined Functions
Sometimes, the rule for a piecewise-defined function can be deduced from its graph by identifying the equations and the intervals where they apply.
Key Point 1: Analyze the graph to see where the function changes its behavior.
Key Point 2: Match each segment to a known function (e.g., linear, quadratic).
Example: A graph with a line for and a constant value for suggests a rule like .

Applications of Piecewise-Defined Functions
Piecewise-defined functions are often used to model real-world situations where rules change based on conditions, such as tax brackets or shipping costs.
Key Point 1: Identify the different cases in the application (e.g., income ranges for tax rates).
Key Point 2: Write a function that describes the output for each case.
Example: On the planet Sarnun, the tax function is:
a. For , dollars.
b. For , dollars.
c. The function above describes the taxes owed as a function of income.
Summary Table: Properties of Piecewise-Defined Functions
Property | Description |
|---|---|
Definition | Uses multiple equations for different intervals |
Evaluation | Choose the correct equation based on the input value |
Graphing | Plot each piece over its domain; mark endpoints |
Applications | Model real-world scenarios with changing rules |
