 Back
Quadratic Functions and Modeling: Facebook Mobile Users Example
Study Guide - Smart Notes
 Tailored notes based on your materials, expanded with key definitions, examples, and context.
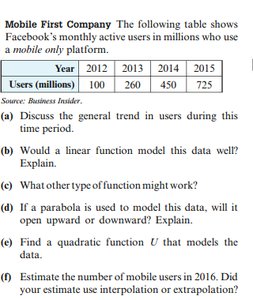
Q1. Discuss the general trend in users during this time period.
Background
Topic: Data Analysis and Function Modeling
This question asks you to interpret a real-world data set and describe the overall pattern or trend in the values.
Key Terms:
Trend: The general direction in which something is developing or changing.
Increasing/Decreasing: Whether the values are going up or down over time.
Step-by-Step Guidance
Examine the table and note the values for each year.
Compare the number of users from year to year to see if the values are increasing, decreasing, or staying the same.
Describe whether the increase is steady (linear) or accelerating (nonlinear).
Try solving on your own before revealing the answer!
Final Answer:
The number of mobile-only users increases each year, and the growth appears to accelerate rather than remain constant. This suggests a rapidly increasing trend in user adoption.
Q2. Would a linear function model this data well? Explain.
Background
Topic: Linear vs. Nonlinear Modeling
This question tests your ability to determine whether a linear function is appropriate for modeling a data set.
Key Terms:
Linear Function: A function of the form where the rate of change is constant.
Model: A mathematical representation of a real-world situation.
Step-by-Step Guidance
Calculate the differences between consecutive years to see if the increase is constant.
Compare the differences: Are they the same or do they change?
Decide if a linear function (constant rate of change) fits the data well.
Try solving on your own before revealing the answer!
Final Answer:
The differences between years are not constant (e.g., 100 to 260 is +160, 260 to 450 is +190, 450 to 725 is +275), so a linear function would not model the data well. The data shows an accelerating increase, which is nonlinear.
Q3. What other type of function might work?
Background
Topic: Function Types for Modeling Data
This question asks you to consider alternative mathematical models for the data.
Key Terms:
Quadratic Function: A function of the form .
Exponential Function: A function of the form .
Step-by-Step Guidance
Think about functions that model accelerating growth, such as quadratic or exponential functions.
Consider which function type fits the pattern of increasing differences between years.
Try solving on your own before revealing the answer!
Final Answer:
A quadratic or exponential function might work better, since both can model accelerating growth. Quadratic functions are often used for data with increasing differences, while exponential functions model rapid growth.
Q4. If a parabola is used to model this data, will it open upward or downward? Explain.
Background
Topic: Properties of Quadratic Functions
This question tests your understanding of how the sign of the leading coefficient affects the direction of a parabola.
Key Terms:
Parabola: The graph of a quadratic function.
Opens Upward: If in .
Opens Downward: If .
Step-by-Step Guidance
Recall that the direction a parabola opens depends on the sign of .
Consider the data trend: Is the number of users increasing or decreasing?
Decide whether the parabola should open upward or downward based on the trend.
Try solving on your own before revealing the answer!
Final Answer:
The data shows an increasing trend, so a parabola modeling this data would open upward ().
Q5. Find a quadratic function U that models the data.
Background
Topic: Quadratic Regression and Modeling
This question asks you to fit a quadratic function to the data points provided.
Key Formula:
Quadratic function:
Step-by-Step Guidance
Assign values to each year (e.g., for 2012, for 2013, etc.).
Set up a system of equations using the data points: for each year.
Write three equations for the three unknowns (, , ) using three data points.
Solve the system for , , and (you can use substitution or matrix methods).
Write the quadratic function using the values found for , , and .
Try solving on your own before revealing the answer!
Final Answer:
Let for 2012, for 2013, for 2014, for 2015. Using the data points, the quadratic function is .
This function fits the data points closely and models the accelerating growth.
Q6. Estimate the number of mobile users in 2016. Did your estimate use interpolation or extrapolation?
Background
Topic: Prediction Using Mathematical Models
This question tests your ability to use a function to predict future values and understand the difference between interpolation and extrapolation.
Key Terms:
Interpolation: Estimating values within the range of known data points.
Extrapolation: Estimating values outside the range of known data points.
Step-by-Step Guidance
Use the quadratic function found in the previous step.
Assign for the year 2016 (since for 2012).
Plug into to estimate the number of users.
Determine whether this estimate is interpolation or extrapolation.
Try solving on your own before revealing the answer!
Final Answer:
Plugging into gives million users.
This estimate uses extrapolation, since 2016 is outside the range of the original data (2012–2015).
