 Back
BackQuadratic Functions: Graphs, Properties, and Applications
Study Guide - Smart Notes
 Tailored notes based on your materials, expanded with key definitions, examples, and context.
Quadratic Functions and Their Graphs
Understanding Quadratic Functions
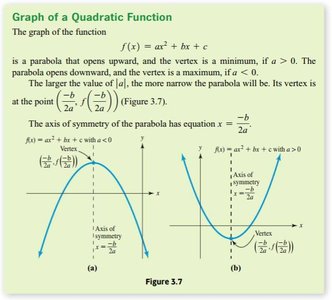
Quadratic functions are a fundamental class of functions in algebra, characterized by the general form , where . Their graphs are called parabolas, which can open either upward or downward depending on the sign of the leading coefficient .
Standard Form:
Vertex Form:
Axis of Symmetry: The vertical line that passes through the vertex, given by in standard form or in vertex form.
Vertex: The highest or lowest point on the parabola, depending on whether it opens downward or upward, respectively.
Key Terminology and Equivalences
Several terms are used interchangeably when discussing quadratic functions:
Zeros of a function: The x-values where .
X-intercepts: The points where the graph crosses the x-axis.
Solutions to the equation: The values of that satisfy .
Properties of Parabolas
Opening Direction and Vertex Type
The direction in which a parabola opens is determined by the sign of :
.
If , the parabola opens upward and the vertex is a minimum.
If , the parabola opens downward and the vertex is a maximum.
Finding the Vertex
The vertex of a parabola in standard form can be found using:
x-coordinate:
y-coordinate:
The axis of symmetry is the vertical line .
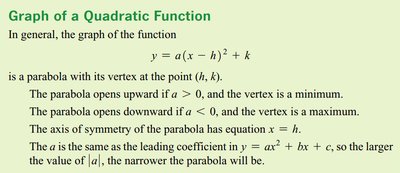
Vertex Form of a Parabola
Writing a quadratic in vertex form makes it easy to identify the vertex:
Vertex Form:
The vertex is at .
The axis of symmetry is .
Graphing Quadratic Functions
Step-by-Step Graphing
Identify the vertex using the formulas above.
Find additional points by substituting x-values into the function.
Plot the vertex and points on the coordinate plane.
Draw the axis of symmetry through the vertex.
Sketch the parabola opening up or down as determined by .

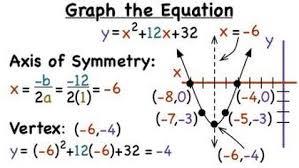
Example: Graphing
Axis of symmetry:
Vertex:
Plot additional points and sketch the parabola.
Solving Quadratic Equations
Determining Quadratic Nature and Vertex Type
To determine if a function is quadratic, check if the highest exponent of is 2. The sign of tells you if the graph is concave up or down, and whether the vertex is a maximum or minimum.

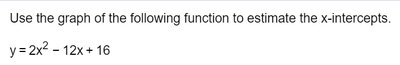
Estimating X-Intercepts from a Graph
The x-intercepts (or zeros) of a quadratic function are the points where the graph crosses the x-axis. These can be estimated visually from the graph or calculated algebraically by solving .
Applications and Calculator Use
Using a Graphing Calculator to Find a Quadratic Model
To fit a quadratic model to data using a graphing calculator:
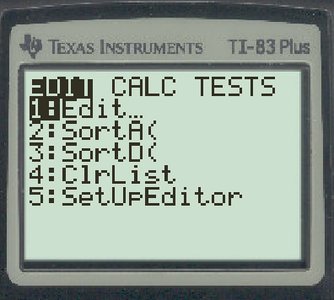
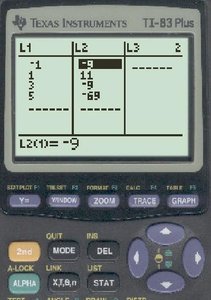
Enter x-values into L1 and y-values into L2 using the STAT → EDIT feature.
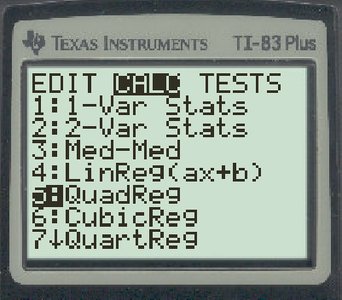
Select STAT → CALC → 5:QuadReg.
Press ENTER to compute the quadratic regression equation.
Construct the equation from the output values of , , and .

Application Example: Maximizing Profit
Quadratic functions are often used in business to model profit, where the vertex represents the maximum profit point. For example, if , the maximum profit occurs at units sold.
Find for maximum profit:
Calculate maximum profit:
Summary Table: Forms and Properties of Quadratic Functions
Form | Equation | Vertex | Axis of Symmetry | Opens |
|---|---|---|---|---|
Standard | Up if , Down if | |||
Vertex | Up if , Down if |
Additional Resources
For further study, refer to helpful videos and multimedia resources in your course platform.
