Back
Rational Functions and Their Graphs: Study Notes for College Algebra
Study Guide - Smart Notes
 Tailored notes based on your materials, expanded with key definitions, examples, and context.
Rational Functions and Their Graphs
Definition of Rational Functions
A rational function is any function that can be written as the ratio of two polynomials, that is:
General form: , where and are polynomials and .
Rational functions are defined for all real numbers except where the denominator equals zero.
Domain of a Rational Function
The domain of a rational function consists of all real numbers except those for which the denominator is zero.
To find the domain, solve and exclude those values from the domain.
Example: For , the domain is all real numbers except .
Example: For , the domain is all real numbers except .
Example: For , the domain is all real numbers since is never zero.
Vertical Asymptotes
A vertical asymptote occurs at values of where the denominator of a rational function is zero (and the numerator is not zero at that point).
To locate vertical asymptotes, solve .
Example: For , the vertical asymptote is at .
Example: For , the vertical asymptote is at .
Horizontal Asymptotes
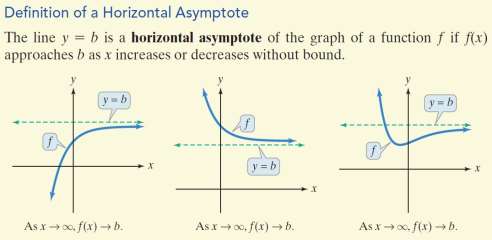
A horizontal asymptote describes the behavior of a function as approaches infinity or negative infinity. The line is a horizontal asymptote if approaches as increases or decreases without bound.
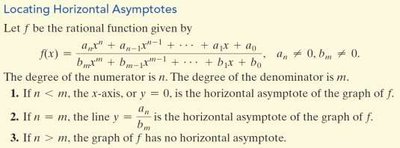
Horizontal asymptotes are determined by comparing the degrees of the numerator and denominator polynomials.
Locating Horizontal Asymptotes
If the degree of the numerator () is less than the degree of the denominator (), the horizontal asymptote is .
If , the horizontal asymptote is , where and are the leading coefficients.
If , there is no horizontal asymptote.
Arrow Notation
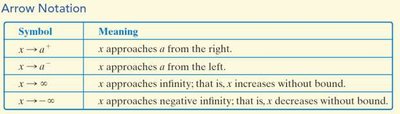
Arrow notation is used to describe the behavior of functions as approaches certain values or infinity.
Symbol | Meaning |
|---|---|
approaches from the right. | |
approaches from the left. | |
approaches infinity; that is, increases without bound. | |
approaches negative infinity; that is, decreases without bound. |
Strategy for Graphing Rational Functions
To graph a rational function, follow these steps:
Determine whether the graph has symmetry (y-axis or origin).
Find the y-intercept by evaluating .
Find the x-intercepts by solving .
Find any vertical asymptotes by solving .
Find the horizontal asymptote using the rules above.
Plot at least one point between and beyond each x-intercept and vertical asymptote.
Use the information to graph the function between and beyond the vertical asymptotes.
Slant (Oblique) Asymptotes
A slant asymptote occurs when the degree of the numerator is exactly one more than the degree of the denominator. The slant asymptote can be found by performing polynomial long division.
Example: For , divide by to find the slant asymptote.
Applications: Average Cost Function
Rational functions are used in business applications, such as average cost functions.
Example: If a company has a fixed monthly cost of C(x) = 500,000 + 400x$.
The average cost function is .
As , the average cost approaches $400$, which is the horizontal asymptote.
This represents the minimum average cost per item as production increases.
Graphing Practice
Use a blank Cartesian grid to practice graphing rational functions, marking intercepts and asymptotes.